Download
1 / 34
430 likes | 733 Views
SPECT imaging with semiconductor detectors. Andy Boston ajboston@liv.ac.uk. Outline of presentation. What is SPECT? What detector technology can we consider? The ProSPECTus project & links to fundamental research The future prospects. What is SPECT?. Functional imaging modality.

E N D
SPECT imaging with semiconductor detectors • Andy Boston • ajboston@liv.ac.uk
Outline of presentation • What is SPECT? • What detector technology can we consider? • The ProSPECTus project & links to fundamental research • The future prospects
What is SPECT? Functional imaging modality
t1/2=65.94h t1/2=6.01h What SPECT Radionuclides? 141 keV 910-5% 2.1105y >99% stable
The sinogram is what we aim to measure • - Measure of intensity as a function of projection, θ and position, r • - Often seen plotted as a 2d grey scale image Tomographic Imaging θ x r y f(x ,y) p(r , θ) Measured result – “Sinogram” (256 projections, 363 positions per projection) Note : We measure from 0 to 180° Underlying source distribution “Shepp-Logan Phantom”
SPECT : Problems/Opportunities Technical • Collimator Limits Spatial Resolution & Efficiency • Collimator is heavy and bulky • Energy of radioisotope limited to low energy • NaI:Tl Dominant for >40 Years... • MRI Existing PMTs will not easily operate • Would like to be able to image a larger fraction of events. Common radionuclides: 99mTc, 123I, 131I
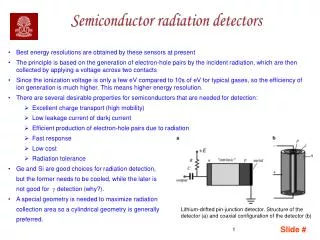
What are the detector requirements? • Ideally would want: • Good energy resolution (Good light yield/charge collection) < few% • High efficiency (High Z) • Position resolution • Timing resolution • Detector materials: • Semiconductors (Si, Ge, CdZnTe) • Scintillators (LaBr3, CsI(Tl), NaI(Tl), BaFl, BGO)
ProSPECTus • Next generation Single Photon Emission Computed Tomography Nuclear Physics Group, Dept of Physics, University of Liverpool, Nuclear Physics & Technology Groups, STFC Daresbury Laboratory, MARIARC & Royal Liverpool University NHS Trust
ProSPECTus: What is new? ProSPECTus is a Compton Imager • Radical change No mechanical collimator • Utilising semiconductor sensors • Segmented technology and PSA and digital electronics (AGATA) • Image resolution 7-10mm 2-3mm • Efficiency factor ~100 larger • Simultaneous SPECT/MRI
Compton camera What’s new? Source Conventional SPECT Gamma rays detected by a gamma camera Inefficient detection method Incompatible with MRI Gamma rays detected by a Compton camera Positions and energies of interactions used to locate the source E0 Factors that limit the performance of a Compton Imager: Energy resolution, Detector position resolution, Doppler Broadening
System Configuration GEANT4 simulations L. Harkness 1cm 2cm • Total Coincident ~3.49% • SPECT ~ 0.025% (typical value) • Factor of ~140 141keV 5cm 2cm Si(Li) Ge
HPGe Germanium • Excellent energy resolution • Medium Z (32) • Lithographic electrode segmentation • Requires cooling to LN2 • HPGe growth still presents challenges • Technology drivers: large scale physics projects (AGATA/GRETA/GERDA/MAJORANA)
AGATA(Advanced GAmma Tracking Array) 4-array for Nuclear Physics Experiments at European accelerators providing radioactive and high-intensity stable beams Main features of AGATA Efficiency: 43% (M=1) 28% (M =30) today’s arrays ~10% (gain ~4) 5% (gain ~1000) Peak/Total: 58% (M=1) 49% (M=30) today ~55% 40% Angular Resolution:~1º FWHM (1 MeV, v/c=50%) ~ 6 keV !!! today ~40 keV Rates: 3 MHz (M=1) 300 kHz (M=30) today 1 MHz 20 kHz • 180 large volume 36-fold segmented Ge crystals in 60 triple-clusters • Digital electronics and sophisticated Pulse Shape Analysis algorithms allow • Operation of Ge detectors in position sensitive mode -ray tracking
4 1 Ingredients of g-Tracking Identified interaction points Reconstruction of tracks e.g. by evaluation ofpermutations of interaction points Highly segmented HPGe detectors (x,y,z,E,t)i g · · Pulse Shape Analysisto decomposerecorded waves · · 2 3 Digital electronics to record and process segment signals reconstructed g-rays
ProSPECTus • Next generation Single Photon Emission Computed Tomography Nuclear Physics Group, Dept of Physics, University of Liverpool, Nuclear Physics & Technology Groups, STFC Daresbury Laboratory, MARIARC & Royal Liverpool University NHS Trust
The SmartPET DSGSD detectors Detector Specification • Depletion at -1300V, Operation at -1800V • 12 x12 Segmentation, 5mm strip pitch • 1mm thick Aluminium entrance window • Warm FET configuration, 300mV/MeV pre-amps • Average energy resolution ~ 1.5keV FWHM @ 122keV
AC01 AC12 Am-241 AC x-y surface intensity distribution • The results are presented for 60 keV with 2 minutes of data per position. DC12 DC1
Pulse Shape Analysis PSA techniques developed through characterisation measurements Calibration of variation in detector pulse shape response with position Real Charge Image Charge Parameterisation of these pulse shapes provides increased position sensitivity
SmartPET detector depth response “superpulse” pulse shapes for 137Cs (662 keV) events versus depth AC signals DC signals DC signals AC signals
Image Reconstruction • Sensors have excellent energy & position information. • Uniformity of sensor response • Optimise existing: • Analytical • Iterative • Stochastic • Requirement for GPU acceleration
Compton Imaging Use of the SmartPET detectors in Compton Camera configuration Typical measurements: • 10μCi152Eu • 6 cm from SPET 1 • Source rotated • Zero degrees in 15º steps up to 60º • Detector separation • 3 – 11cm in 2cm steps • Gates set on energies • 2 sources 152Eu and 22Na at different x and y
Compton Imaging • Compton Cones of Response projected into image space
Compton Imaging • Compton Cones of Response projected into image space
Compton Imaging • Compton Cones of Response projected into image space
Compton Imaging • Compton Cones of Response projected into image space
Compton Imaging • Compton Cones of Response projected into image space
Compton Camera measurements (Ge/Ge) E = 1408 keV, 30 keV gate 6 cm source to crystal 30 mm crystal to crystal No PSA (5x5x20) Iterative reconstruction FWHM ~ 8mm
Compton Imaging Multi-nuclide imaging ~7º Angular Resolution FWHM, central position 152Eu E = 1408 keV 22Na E = 1274 keV 152Eu 2cm source separation No PSA (5x5x20) Cone back projection
MRI compatibility & Status • Test existing gamma-ray detector in an MRI scanner • Does the detector cause distortions in the MRI image? No • Does the MRI system degrade the detector performance? In certain positions (which can be minimised) • Encouraging results! • ProSPECTusfinal construction stage • System in ~6months
What are the next steps? • Immediate priorities • We (almost) have an integrated Compton Gamma camera optimised for <500keV • Demonstrate sensitivity with phantoms • Commence trials including clinical evaluation • For the future: • Consider electron tracking Si scatterer • Possible use of large CZT analyser (requires large wafer material with 1cm thickness)
ProSPECTus : The Implication Patient benefits: • Earlier and more effective diagnosis of tumours (higher probability of effective treatment). • Higher sensitivity offering the scope for shorter imaging time (more patients through one machine per day) or lower doses of radio pharmaceuticals. • Cardiac and brain imaging • Image larger patients SPECT/MRI: • Functional/Anatomical • Image co-registration
Credit STFC Daresbury Laboratory, Daresbury, WA4 4AD, UK Department of Physics, University of Liverpool, L69 7ZE, UK MARIARC, University of Liverpool, RLUH NHS Trust, UK Industries Funding agencies STFC, EPSRC, MRC Many people have made significant contributions Lots of UK PhD’s and Post Docs Laura Harkness University of Liverpool 2010 Shell and Institute of Physics Very Early career Woman Physicist of the Year