Download
1 / 12
130 likes | 478 Views
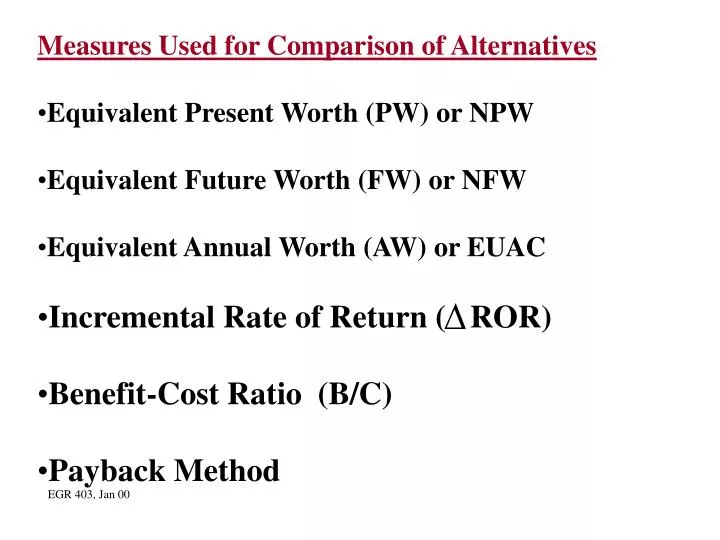
Measures Used for Comparison of Alternatives Equivalent Present Worth (PW) or NPW Equivalent Future Worth (FW) or NFW Equivalent Annual Worth (AW) or EUAC Incremental Rate of Return ( ROR) Benefit-Cost Ratio (B/C) Payback Method. EGR 403, Jan 00.

E N D
Measures Used for Comparison of Alternatives • Equivalent Present Worth (PW) or NPW • Equivalent Future Worth (FW) or NFW • Equivalent Annual Worth (AW) or EUAC • Incremental Rate of Return ( ROR) • Benefit-Cost Ratio (B/C) • Payback Method EGR 403, Jan 00
Please refer to the example in class notes on Web page called “Example on NPW, NFW, AW”
Net Present Worth = NPW = PWBenefit -PWCost • Looking for: NPW > 0, or highest NPW • Situations: • Equal useful life (study period) • Unequal useful life • Least common multiple period • A fixed period and consider terminal value • Infinite analysis period, capitalized cost = P = A/i • Assumptions: • End-of-year convention, Stable prices, Sunk cost, • Analysis point of view EGR 403, Jan 99
Equivalent Uniform Annual Cost, EUAC Notation: S =Salvage value at the end of the analysis period EUAC= P(A|P,i,n) - S(A|F,i,n) = (P - S)(A|P,i,n) + Si = (P - S)(A|F,i,n) + Pi = NPW(A|P, i, n) (A|P, i, ) = I The Repeatability Assumption EGR 403, Jan 99
Internal Rate of Return, IRR, is the interest rate at which the discounted present worth of benefits equals the discounted present worth of costs, i.e. the Net Present Worth, NPW, = 0. Minimum Attractive Rate of Return, MARR is that interest rate which is equal to the highest one of the following: * The current interest rate for borrowing money from various sources * The average interest rate paid by the firm for the cost of capital (Bank loans, Corporate Bonds, Stock Dividends) * The opportunity cost which equals the rate of return on the last accepted or best rejected project or investment which is still available. EGR 403, Jan 99
IRR analysis is generally a “trial and error” solution. A plot of NPW vs. i will yield a value of IRR for NPW = 0. IRR criteria: If IRR >= MARR, the investment is considered acceptable. Problems with multiple changes in the sign of the net cash flows may produce multiple rates of return. The Cash Flow Rule of Signs states that the maximum number of possible rates of return for any given analysis is equal to the number of cash flow reversals during the period of study. EGR 403, Jan 99
Example: Find IRR for the following cash flow. Initial cost (now) $2,000 Annual income for 15 years $120 Salvage value at the end of 15th year $1,800 PW = -2000 + 120(P|A, i, 15) + 1800(P|F, i, 15) TrialInterest rate. NPW . 1 10% -2000 + 120(7.606) + 1800(0.2394) = -656.36 2 7% -2000 + 120(9.108) + 1800(0.3624) = -254.72 3 5% -2000 + 120(10.38) + 1800(0.481) = 111.4 4 6% -2000 + 120(9.712) + 1800(0.4173) = -83.42 Interpolation using Trial 1 and 2 >>>> IRR = 5.09 Interpolation using Trial 3 and 2 >>>> IRR = 5.61 Interpolation using Trial 3 and 4 >>>> IRR = 5.57 IRR = 5.56% using Excel!! EGR 403, Jan 00
Example: Two possible investments (X and Y) are under consideration. The following table shows the estimated cash flow for each alternative and their IRR. MARR = 20% . Year . IRR 0 1 2 3 Alternative X -$1000 $500 $500 $500 23% Alternative Y -$250 0 0 $500 26% Which one of the investments will you select and why? EGR 403, Jan 04
Rate of return analysis is performed by computing the Incremental Rate of Return ( ROR) based on the differences between the net cash flows of two alternatives with equal analysis periods. For increments of investment, set up a "decision tree" starting with the lowest initial cost alternative and work your way up to the highest initial cost alternative. ROR criteria: If ROR >= MARR, choose the higher-cost alternative If ROR < MARR, choose the lower-cost alternative EGR 403, Jan 99
Other Measures Used for Comparison: Benefit-Cost Ratio For a given MARR = (PW of benefits) / (PW of costs) If (X) > 1 , then accept X For two alternatives use incremental cash flow: If (X-Y) > 1 , then rank X > Y If (X-Y) < 1 , then rank Y > X For the future cash flow we may argue if a cash flow can be considered for numerator or denominator for this calculation. However, the final conclusion will not change. EGR 403, Jan 2000
Please refer to the example in class notes on Web page called “Example on IRR and B/C”
Payback method The period of time required for the profit to equal the cost of investment. Drawback: * Ignores consequences that are beyond the end of the payback period Possible benefit: * Prospective investments are highly uncertain * Current capital is extremely limited and will continue to be limited EGR 403, Jan 99