Download
1 / 1
10 likes | 81 Views
C Content and C Changes in Soils of the Forestry Sector of Mexico J. Etchevers 1 ; C. Balbontín 1 ; F. Paz 1 ; Ben de Jong 2 ; O. Masera 3 1 Colegio de Postgraduados; 2 ECOSUR; 3 CIECO-UNAM e-mail: jetchev@colpos.mx. Materials and Methods.

E N D
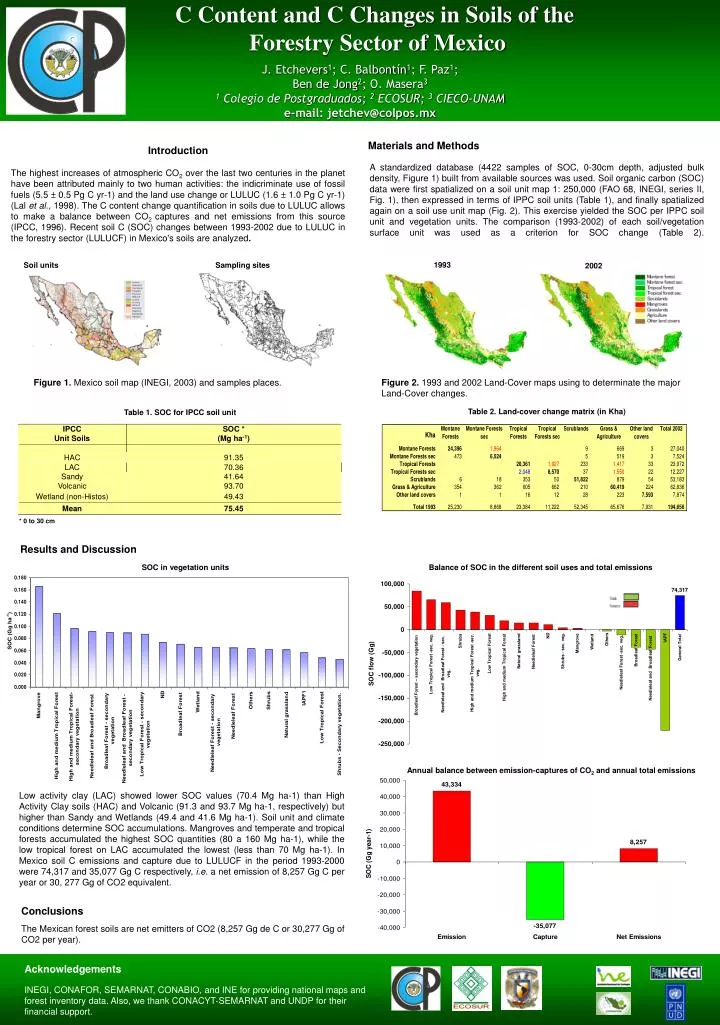
C Content and C Changes in Soils of the Forestry Sector of Mexico J. Etchevers1; C. Balbontín1; F. Paz1; Ben de Jong2; O. Masera3 1 Colegio de Postgraduados; 2 ECOSUR; 3CIECO-UNAM e-mail: jetchev@colpos.mx Materials and Methods IntroductionThe highest increases of atmospheric CO2 over the last two centuries in the planet have been attributed mainly to two human activities: the indicriminate use of fossil fuels (5.5 ± 0.5 Pg C yr-1) and the land use change or LULUC (1.6 ± 1.0 Pg C yr-1) (Lal et al., 1998). The C content change quantification in soils due to LULUC allows to make a balance between CO2 captures and net emissions from this source (IPCC, 1996). Recent soil C (SOC) changes between 1993-2002 due to LULUC in the forestry sector (LULUCF) in Mexico's soils are analyzed. A standardized database (4422 samples of SOC, 0-30cm depth, adjusted bulk density, Figure 1) built from available sources was used. Soil organic carbon (SOC) data were first spatialized on a soil unit map 1: 250,000 (FAO 68, INEGI, series II, Fig. 1), then expressed in terms of IPPC soil units (Table 1), and finally spatialized again on a soil use unit map (Fig. 2). This exercise yielded the SOC per IPPC soil unit and vegetation units. The comparison (1993-2002) of each soil/vegetation surface unit was used as a criterion for SOC change (Table 2). 1993 Soil units Sampling sites 2002 Figure 1. Mexico soil map (INEGI, 2003) and samples places. Figure 2. 1993 and 2002 Land-Cover maps using to determinate the major Land-Cover changes. Table 2. Land-cover change matrix (in Kha) Table 1. SOC for IPCC soil unit * 0 to 30 cm Results and Discussion SOC in vegetation units Balance of SOC in the different soil uses and total emissions Annual balance between emission-captures of CO2 and annual total emissions Low activity clay (LAC) showed lower SOC values (70.4 Mg ha-1) than High Activity Clay soils (HAC) and Volcanic (91.3 and 93.7 Mg ha-1, respectively) but higher than Sandy and Wetlands (49.4 and 41.6 Mg ha-1). Soil unit and climate conditions determine SOC accumulations. Mangroves and temperate and tropical forests accumulated the highest SOC quantities (80 a 160 Mg ha-1), while the low tropical forest on LAC accumulated the lowest (less than 70 Mg ha-1). In Mexico soil C emissions and capture due to LULUCF in the period 1993-2000 were 74,317 and 35,077 Gg C respectively, i.e. a net emission of 8,257 Gg C per year or 30, 277 Gg of CO2 equivalent. Conclusions The Mexican forest soils are net emitters of CO2 (8,257 Gg de C or 30,277 Gg of CO2 per year). • Acknowledgements • INEGI, CONAFOR, SEMARNAT, CONABIO, and INE for providing national maps and forest inventory data. Also, we thank CONACYT-SEMARNAT andUNDPfor their financial support.