1 / 1

xenia
Download Presentation

An Image/Link below is provided (as is) to download presentation Download Policy: Content on the Website is provided to you AS IS for your information and personal use and may not be sold / licensed / shared on other websites without getting consent from its author. Content is provided to you AS IS for your information and personal use only. Download presentation by click this link. While downloading, if for some reason you are not able to download a presentation, the publisher may have deleted the file from their server. During download, if you can't get a presentation, the file might be deleted by the publisher.

E N D

Presentation Transcript


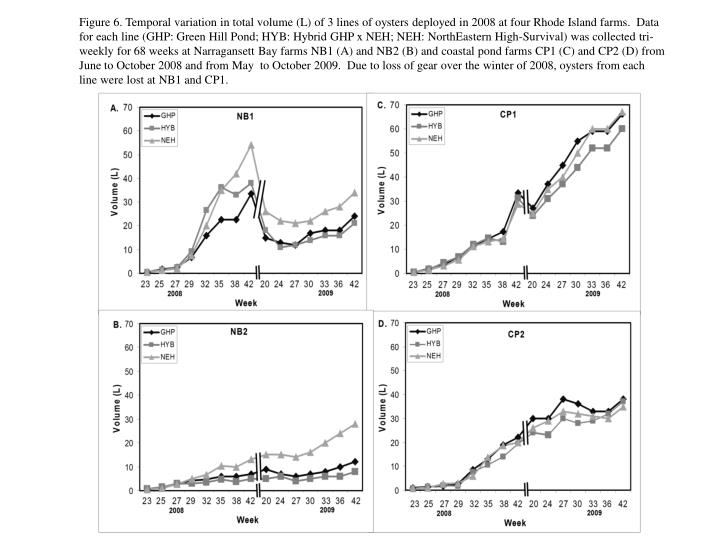
  1. Figure 6. Temporal variation in total volume (L) of 3 lines of oysters deployed in 2008 at four Rhode Island farms. Data for each line (GHP: Green Hill Pond; HYB: Hybrid GHP x NEH; NEH: NorthEastern High-Survival) was collected tri-weekly for 68 weeks at Narragansett Bay farms NB1 (A) and NB2 (B) and coastal pond farms CP1 (C) and CP2 (D) from June to October 2008 and from May to October 2009. Due to loss of gear over the winter of 2008, oysters from each line were lost at NB1 and CP1.

More Related