1 / 1

Time Spent Per Week With TV A18-49/ DVR v. Non-DVR HH

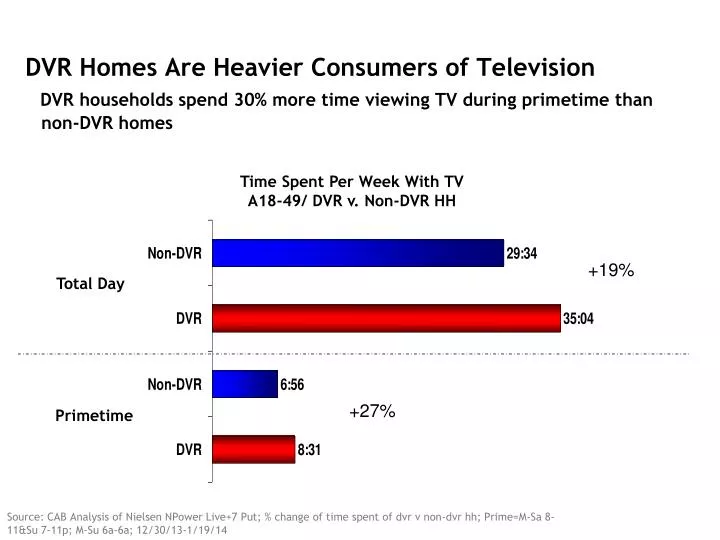
DVR Homes Are Heavier Consumers of Television DVR households spend 30% more time viewing TV during primetime than non-DVR homes. Time Spent Per Week With TV A18-49/ DVR v. Non-DVR HH. +19%. Total Day. +27%. Primetime.

Download Presentation

Time Spent Per Week With TV A18-49/ DVR v. Non-DVR HH

An Image/Link below is provided (as is) to download presentation Download Policy: Content on the Website is provided to you AS IS for your information and personal use and may not be sold / licensed / shared on other websites without getting consent from its author. Content is provided to you AS IS for your information and personal use only. Download presentation by click this link. While downloading, if for some reason you are not able to download a presentation, the publisher may have deleted the file from their server. During download, if you can't get a presentation, the file might be deleted by the publisher.

E N D

Presentation Transcript


  1. DVR Homes Are Heavier Consumers of TelevisionDVR households spend 30% more time viewing TV during primetime than non-DVR homes Time Spent Per Week With TV A18-49/ DVR v. Non-DVR HH +19% Total Day +27% Primetime Source: CAB Analysis of Nielsen NPower Live+7 Put; % change of time spent of dvr v non-dvr hh; Prime=M-Sa 8-11&Su 7-11p; M-Su 6a-6a; 12/30/13-1/19/14

More Related