Download
1 / 24
310 likes | 625 Views
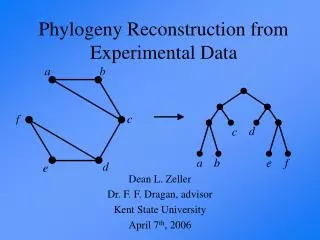
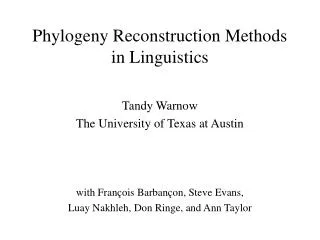
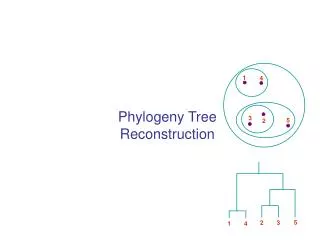
3. The reconstruction of phylogeny. The first Darwinian principle told that every phylogenetic tree has one common ancestor . Phylogen e tic analysis is the study of taxonomic relationships among lineages . Phylogenetic systematics Cladistics (greek κλάδος : branch). Numerical taxonomy.

E N D
3. The reconstruction of phylogeny The first Darwinian principle told that every phylogenetic tree has one common ancestor. Phylogenetic analysis is the study of taxonomic relationships among lineages. Phylogenetic systematics Cladistics (greek κλάδος: branch) Numerical taxonomy Robert Sokal(1927-) Willi Hennig (1913-1976)
http://www.faunaeur.org/ http://tolweb.org/tree/phylogeny.html http://www.eol.org/
The cladistic methodology Apomorphies are common derived characters. Autapomorphies are characters that are restricted to single lineages. B C D A ade abc abd adf Plesiomorphies are ancestral derived characters. e c f e d b e: Autapomorphy of lineage D b: Synapomorphy of lineage C+D a d: Plesiomorphy of lineage A It is a symplesiomorphy Ancestor a: Apomorphy of the whole tree It is the ancestral state. The collective set of plesiomorphies defines the ground plan of a phylogenetic tree.
B C A C is the sister taxon of A and B ade abd adf Character d in lineages A, B, and C is nothomologous because it derived twice. It is homoplasious e d f Character a in lineages A, B, and C is homologous because it synapomorph d b a Ancestor Monophyletic taxon Paraphyletic taxon The ultimate aim of taxonomy is to group higher taxa into monophyletic subtaxa. For this task we have to infer autapomorphies Autapomorphy defines monophyly B A C D E f d e f Polyphyletic taxon b b d Ancestor
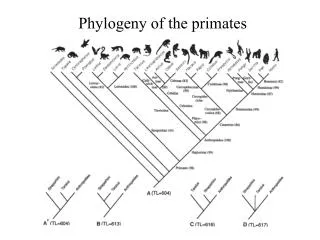
Tetrapoda The diversification of an evolutionary tree is called cladogenesis Amniota Archosauria Actino-pterygia Dipnoi Anura Urodela Mammalia Squamata Aves Therosauria Loss of tailapomorph Mammaeautapomorph Reptilia(paraphyletic) Feathersapomorph Amnionapomorph Tetrapod limbsapomorph The evolutionary change within a lineage is called anagenesis Common ancestor Lungsplesiomorph
Linnean systematics and cladistics Linnean approach Hierachical encaptive system Phenomenological method based on similarity It uses grades (groups of similar body plan) Different taxonomies are possible There is no clear decision intrument for taxonomies The number of higher taxa is rather small (Pisces, Amphibia, Reptilia, Aves, Mammalia) It does not assume common evolutionary history It does not reconstruct evolution Taxonomy is independent of evolution Hennigean approach Hierachical encaptive system Analytical method based on lineage branching It uses clades (groups of identical root) Only one taxonomic solution is allowed Autapomorphies decide about taxonomic position The number of higher taxa is large (Pisces, Amphibia, Reptilia are not valid taxa ) It is based on common evolutionary history It does reconstruct evolution Taxonomy is a part of evolutionary theory High resolution trees Low resolution trees
Phylogenetic tree of winged insect orders Devonian Carboniferous Permian Triassian Jurassic Cretaceous Paleogene to recent Palaeodictyoptera Odonata Ephemeroptera Devonian origin Dictyoptera Low resolution Plecoptera Zoraptera Embioptera Isoptera In the Triassic period all extant taxa already existed Dermaptera Radiation Grylloblatodea Phasmida Orthoptera Mallophaga Psocoptera Thysanoptera Heteroptera Hymenoptera Rhyniognatha hirsti Neuroptera Coleoptera The tree lacks 9 orders that went extinct by the end of the Permian Siphonaptera Mecoptera Radiation Diptera Trichoptera Lepidoptera
The construction of phylogenetic trees from numerical methods The principle of maximum parsimony (Occam’s razor) holds that we should accept that phylogenetic tree that can be constructed with the least number of morphological changes. The raw data A B D E C 001101 110111 101101 010010 8 changes Distance matrix 111111 A B D E C 001101 Outgroup 101101 010010 111111 We are looking for such a tree that minimizes the sum of distances. 010111 How to define the root? 110111 7 changes
Parsimony analysis To find the most parsimonious tree we have to cross all combinations of lineages (trees) with all character combinations at the root. The number of possible trees
Neighbour joining Neighbour joining is particularly used to generate phylogenetic trees You need similarities (phylogenetic distances) d(XY) between all elements X and Y. Dissimilarities Calculate Select the pair with the lowest value of Q Calculate new dissimilarities Calculate the distancies from the new node
Raven Mouse Octopus Lumbricus Raven Mouse Protostomia Vertebrata Protostomia
Assumption of the numerical methods Birds Mammals Characters (or transitions) have to be independent. Impossible character states have to be excluded. Fish Loss of hairs Loss of feathers Hairs Incompatible Feathers Scales Characters are assumed to have equal importance. In reality transitions are not comparable. To overcome this problem you give character weights. Technically you multiply the occurrence of a character in a distance matrix
http://evolution.genetics.washington.edu/phylip/software.htmlhttp://evolution.genetics.washington.edu/phylip/software.html
Trees from molecular data Distance matrix
Evolutionary time scales The molecular clock Numbers of amino acid substitutions and therefore trespective numbers of nucleotide substitutions are for many proteins and genomes approximately proportional to time. Hence, numbers of substitutions are a measure of time of divergence from the latest common ancestor. Tomoko Ohta(1933-) Linus Pauling (1901-1994) Motoo Kimura(1924-1994) Emile Zuckerkandl(1922-) Substitutions alone provide a relative time scale Errors An appropriate calibration adds the absolute time scale Superoxide dismutase
Applying the molecular clock A B C D The length of a tree segment is a measure of the duration of a lineage 1 3 Is it possible to convert numbers of character changes into evolutionary time scales? 4 2 The Jukes Cantor model now assumes that the probabilities l of any transition within these 4 nucleotides is the same. Ancestor l/3 G A l/3 l/3 C T l/3 Assuming that transition probability is time independent (every period has the same transition probability). The probability distribution follows an Arrhenius model.
A→T: A→G: A→C: A→A: What is the probability to get exactly x differences out of n possible? We apply the binomial: We apply the principle of maximum likelihood. We are interested in the time that maximizes this function. Hence we need the root of the first derivative The distances t are now used in distance matrices to construct the phylogenetic tree
Paleontological versus molecular timescales Molecular estimates point frequently much more ancient divergences of lineages than estimates based on the fossil record. The reason are different speeds of morhological and genetical changes. Changes in genetic constitution accumulate to a point where basic regulatory elements are involved Changes in genetic constitution involve first basic regulatory elements. Gene flow up to 2 mya Time axis Time axis First fossils of placental orders (65 mya) Genetical change Genetical change Molecular divergence (4-5 mya) Eomaia (125 mya) First fossils of erect hominids(6-7 mya) Molecular divergence of placental orders (120-140 mya) Morphological change Morphological change
Paleontological versus molecular timescales Matching of molecular and paleontological timescales in Echinodermata For the majority of Echinoderm subtaxa molecular divergence estimates are higher than the paleontological estimates. Data from Smith et al. (2006)
Paleontological versus molecular timescales Data from Qun et al. (2007)
Have all phylogenetic trees a single root? Darwin’s first principle: All species of a given taxon have a common ancestor. Parsimony analysis cannot answer this question. A brush would always have a lower number of character changes Theory of Lamarck • A brush means: • No speciation. • If we except that extinction occurs this would mean a constant decrease in the number of species. • Character change within whole species. • No genetic (character) variability within populations. • Extreme longevity of lineages. Scale of organization Scala naturae Spontaneous origin of simple life forms Time But horizontal gene transfer and might at least in bacteria result in networks and rings!
Evolution and development (EvoDevo) August Weismann (1834-1914) Ernst Haeckel(1834-1919) Theory of recapitulation The ontogeny of advanced species recapitulates respective stages in ancestral forms. The soma - germ line distinction makes it impossible to transmit acquired characters to the next generation In fact, only basic genetic programs are conserved and modifications at all stages of ontogenesis appear. Haeckel’s rule is only a crude approximation.
Today’s reading Phylogenetic systematics: http://evolution.berkeley.edu/evolibrary/article/phylogenetics_01 Cladistics: http://en.wikipedia.org/wiki/Cladistics Ernst Haeckel: Kunstformen der Natur (Internet exhibition of original drawings: http://caliban.mpiz-koeln.mpg.de/~stueber/haeckel/kunstformen/liste.html The modern molecular clock: http://awcmee.massey.ac.nz/people/dpenny/pdf/BromhamPenny_2003.pdf