Download
1 / 158
1.7k likes | 2.17k Views
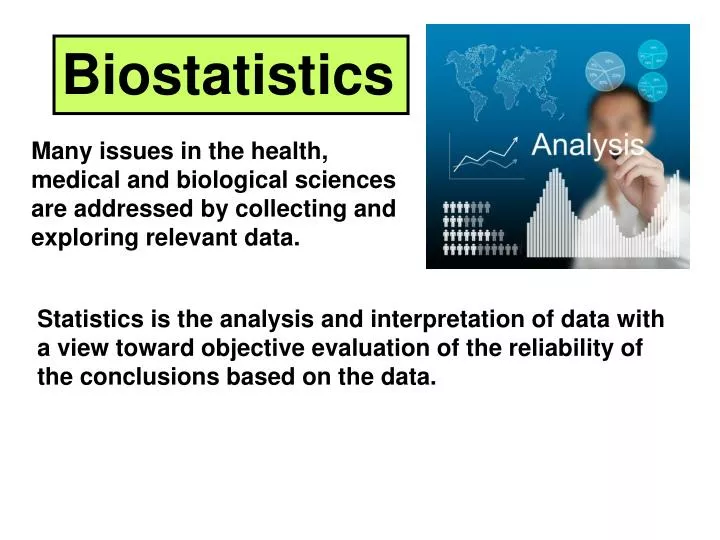
Biostatistics. Many issues in the health, medical and biological sciences are addressed by collecting and exploring relevant data. Statistics is the analysis and interpretation of data with a view toward objective evaluation of the reliability of the conclusions based on the data.

E N D
Biostatistics Many issues in the health, medical and biological sciences are addressed by collecting and exploring relevant data. Statistics is the analysis and interpretation of data with a view toward objective evaluation of the reliability of the conclusions based on the data.
Statistics, is simply the most important tool of the sciences, particularly biology. Because scientists often must use large amounts of data to gain a representative sample of a population, it is not possible to simply look at the numbers and understand what is happening. Statistics allows a trained person to see the significance of data, the relationship between seemingly unrelated phenomena, and predict what may happen in the future or determine what may have happened in the past.
Statistics, however, is not only useful in science. Insurance agencies use actuary tables to determine the likelihood that you will have a car accident and will adjust your premiums accordingly. Doctors can determine the likelihood that you will develop cancer or a have a heart attack. And, political scientists use statistics to determine how citizens feel about current issues and their likelihood to vote for a particular candidate.
Variables Variable: A characteristic that may differ from one biological entity another. Example: lifespan, mass, height, body temperature, etc. Continuous variable:A variable that can have any value within a certain range. Example: height of a plant, mass of an acorn, time Discrete or discontinuous variable: A variable that can take only certain values Example: # of eggs in a bird clutch, # leaves on a plant
Types of data Qualitative data: observations Example: The substance produces bubbles when it dissolves in water. Quantitative data: measured values that have a numeric portion and a unit (dimension)
Measurements Units: Science uses the metric (SI) system. The following units are commonly used in biology.
Uncertainty:All measurements have uncertainty which is usually shown with +/- notation Why aren’t measurements perfect? The causes of measurement errors can be divided into three broad classes: systematic problems, limited precision, and random effects. There are two sources of error in a measurement: (1) limitations in the sensitivity of the instruments used and (2) imperfections in the techniques used to make the measurement. These errors can be divided into two classes: systematic and random.
Systematic error can be caused by an imperfection in the equipment being used or from mistakes the individual makes while taking the measurement. A balance incorrectly calibrated would result in a systematic error. Consistently reading a buret wrong would result in a systematic error. 1. Systematic errors occur when a piece of equipment is improperly constructed, calibrated or used. One does not generally include systematic errors in the uncertainty of a measurement: if you know that a systematic problem exists, you should fix the problem.
2. Random errors most often result from limitations in the equipment or techniques used to make a measurement. No measurement device can read a value to infinite precision. Dials and linear scales, such as meter sticks, thermometers, gauges, speedometers, and the like, can at best be read to within one tenth of the smallest division on the scale. For measuring devices having a digital readout, the minimum uncertainty is in the last digit. This is the best case scenario... the uncertainty can be larger for a variety reasons. 3. It is commonly the case that repeated measurements of the same quantity do not yield the same values, but rather a spread of values. This variation of measurements are random errors and could be due to both human and physical causes.
Accuracy and precision Accuracy is the nearness of a measurement to the actual value. Precision refers to the closeness to each other of repeated measurements of the same quantity.
Significant figures It is important to be honest when reporting a measurement, so that it does not appear to be more accurate than the equipment used to make the measurement allows. We can achieve this by controlling the number of digits, or significant figures, used to report the measurement. Determining the Number of Significant Figures The number of significant figures in a measurement, such as 2.531, is equal to the number of digits that are known with some degree of confidence (2, 5, and 3) plus the last digit (1), which is an estimate or approximation.
As we improve the sensitivity of the equipment used to make a measurement, the number of significant figures increases.
Rules for counting significant figures are summarized below 1. Zeros withina number are always significant. Both 4,308m and 40.05m contain 4 significant figures. 2. Zeros in front of numbers are not significant figures. 0.07 g has one sig fig and 0.00505 g has three. 3. Trailing zeros that aren't needed to hold the decimal point are significant. For example, 4.00 cm has three significant figures and 12.50 cm has four. 4. Zeros that come after numbers but before the decimal point may or may not be significant. The number 12,000g could have 2,3,4, or 5 sig figs. In this case... Exponential notation is used to show the correct significant figures Example: Show 12,000 with 3 and 5 sig figs
How many sig figs do these # have? 15.50 mL 0.0055 g 125,000 cm (D) 205.0 mg 4 2 3,4,5, or 6 4
B. ZEROS: Zeros may be significant or they may merely serve to locate the decimal point. 1. Zeros between numbers (“captive zeros”) are alwayssignificant. examples: 1.007 107.08 1001 2. Zeros in front of numbers (“leading zeros”) are notsignificant! examples: 0.7 g 0.006 cm 0.007050 kg 5 4 4 # of sig figs = 1 1 4 # of sig figs =
3. Zeros behindnumbers (“trailing zeros”) may or may not be significant: (a) Zeros behindnumbers are significant if there is a decimal point . examples: 1.200 12.0 1 20.000 120. 3 3 6 4 # of sig figs =
(b) Zeros behind numbers in front of the decimal point may or may not significant. (You cannot tell which figure was the estimated one) examples: 120 1,200 1,000,000 (1) Exponential notation is used to indicate how many sig figs there are for sure in numbers like these. (a) Write the number 100,000 with ... 1 sig fig 3 sig figs 5 sig figs 2, 3 or 4 2 or 3 1 to 7 # of sig figs =
How many significant figures are there in each of the following? (a) 107.0 (b) 0.0084 15,000 0.0750 0.060070 g 4 2 2,3,4, or 5 3 5
Addition and Subtraction with Significant Figures:When combining measurements with different degrees of accuracy and precision, the accuracy of the final answer can be no greater than the least accurate measurement. This principle can be translated into a simple rule for addition and subtraction: When measurements are added or subtracted, the answer can contain no more decimal places than the least accurate measurement.
Rules for using significant figures in calculations For addition and subtraction round off the answer to the same decimal place as the number that has its last digit in he highest decimal place .
D. ADDITION AND SUBTRACTION: The answer should be rounded off after adding or subtracting, so as to retain digits only as far as the first column containing estimated figures. (remember that the last figure is estimated) examples: a. 12.2 b. 17.17 c. 107.42 14 6.2 9.759 + 0.036+11.080+333 34.450 26.236 450.179 450 26 34.4 4.50 x 10²
Multiplication and Division With Significant Figures The same principle governs the use of significant figures in multiplication and division: the final result can be no more accurate than the least accurate measurement. In this case, however, we count the significant figures in each measurement, not the number of decimal places: When measurements are multiplied or divided, the answer can contain no more significant figures than the least accurate measurement (the number with the fewest sig figs).
Rules for using significant figures in calculations For multiplication and division round off the answer so that it has the same number of significant figures as the value with the least significant figures.
E. MULTIPLICATION AND DIVISION: The answer should be rounded off to contain only as many sig figs as the number with the fewest sig figs. examples: a. 17.24 x 0.52 = b. 118.24 x 3.5 = c. 1.007 x 14.40 7.58 9.0 8.9648 4.1x10² 413.84 = 1.9130343 1.91
When making measurements of variables it is important to use the correct number of significant figures. The significant figures of a measurement are the digits that denote the accuracy. The significant figures of a measurement are all the digits that are known plus an estimated one.
UNCERTAINTY IN MEASUREMENTS ACCURACY AND PRECISION UNCERTAINTY IN MEASUREMENTS ACCURACY AND PRECIS INTRODUCTION: Science is a quantitative... it uses lots of numbers! These numbers come from experimental measurements and each measurement has some degree ofuncertainty in it. 1. Reasons for UNCERTAINTY in measurement... (a) ______________ = Construction of the device (b) ________ ______= Incorrect usage of the device (c) ______________ = Temperature, pressure, etc. (d) ______________ = the device is not functioning properly . Tolerance human error conditions calibration
"Any measurement that you make without the knowledge of its uncertainty is completely meaningless.” Professor Walter Lewin, MIT
2. Methods of expressing uncertainty... (a) +/- Notation (b) Accuracy and Precision : The dartboard analogy accurate(av.) precise but accurate not accurate not precise not accurate and precise not precise 9 8 . . . . . . . . . . . . 3. Explain how a student can get precise inaccurate measurements.
Precision and Accuracy in Measurements How can a student make precise yet inaccurate measurements? Measure consistently but incorrectly because… 1) The student measures incorrectly or 2) the device itself is not functioning properly.
ACCURACY AND PRECISION ACCURACY = the closeness of a measurement to the ________ value.(accuracy is expressed in terms of _______) 1. ABSOLUTE ERROR (Ea) = This is the difference between the ________ (True) value and the ____________ (experimental) value. Equation Ea= |O - A| Ea= absolute error O = Observed value A = Accepted value actual error actual observed
2. RELATIVE ERROR (Er) = This is the error of a measurement expressed as a percent and is often called _________ error. a. Equation Er = relative (%) error percent b. EXAMPLE 1: A student experimentally finds the density of an aluminum block to be 2.37 g/cm3. If aluminum has a density of 2.70 g/cm3 what are the absolute and relative error of the density?
c. Which of the two methods of expressing error (absolute or relative) is most useful? Why? Relative error… it shows how far off you are compared to what you should be
Populations and Samples A population (N) is the entire collection of measurements about which one wants to draw conclusions. If a population is very small it might be practical to obtain all the measurements in a population. Average winning height of World champion gold medal winning high jumpers 2011 World Champion Jesse Williams USA 7' 9 1/4"
Sample Population (n) Usually populations being investigated are too large to actually be measured so a subset of the population, called a sample (n) is measured. Conclusions about the characteristics of the population can then be drawn from characteristics of the sample. EXAMPLE: What % of the USA population hasblue eyes?
Random Sampling To reach valid conclusions about populations statistical procedures assume that they are obtained in a random fashion. For a sample to be random each member in the population has an equal and independent chance of being selected. Selection bias, where there is an error in choosing the individuals or groups to take part in a scientific study. It includes sampling bias, in which some members of the population are more likely to be included than others. Spectrum bias consists of evaluating the ability of a diagnostic test in a biased group of patients, which leads to an overestimate of the sensitivity and specificity of the test.
Single-blind study Single-blind describes experiments where information that could introduce bias or otherwise skew the result is withheld from the participants, but the experimenter will be in full possession of the facts. A classic example of a single-blind test is the "Pepsi challenge".
Placebo A Placebo is a simulated or otherwise medically ineffectual treatment for a disease or other medical condition intended to deceive the recipient. Sometimes patients given a placebo treatment will have a perceived or actual improvement in a medical condition, a phenomenon commonly called the placebo effect. In medical research, placebos are given as control treatments and depend on the use of measured deception.
Double-blind study double-blind study - an experimental procedure in which neither the subjects of the experiment nor the persons administering the experiment know the critical aspects of the experiment; "a double-blind procedure is used to guard against both experimenter bias and placebo effects"
Double-blind study Double-blinding is easy to achieve in drug studies, by making the investigational drug and the control (either a placebo or an established drug) with identical appearance (color, taste, etc.). Patients are randomly assigned to the control or experimental group and given random numbers by a study coordinator, who also encodes the drugs with matching random numbers. Neither the patients nor the researchers monitoring the outcome know which patient is receiving which treatment, until the study is over and the random code is broken.
What is the purpose of a double blind study? The purpose of a double-blind study is to eliminate the risk of prejudgment by the participants, which could distort the results.
Measures of Central Tendency In both populations and samples you generally find more values around the middle of the observed range of values. To a statistician the description of this concentration near the middle is an average, or a measure of central tendency .
Measures of Central Tendency Measures of central tendency are used to describe a "typical" number in a data set. There are different ways to find a typical number and there are advantages and disadvantages to each. Two commonly-used measures of central tendency are the mean and the median. Mean: The mean is the average. The mean of a group of numbers is obtained by adding the numbers and then dividing the sum by the total number of data.