Download
1 / 1
10 likes | 18 Views
List of Symbols. A, B = Geometric coeff., A = .095, B=-2.02 B D = mine burial depth C r = drag coefficient for total stress D 0 = mine diameter d 50 = median grain diameter f w = wave friction factor g = gravitational acceleration h = water depth p = 0.6, geometric parameter

E N D
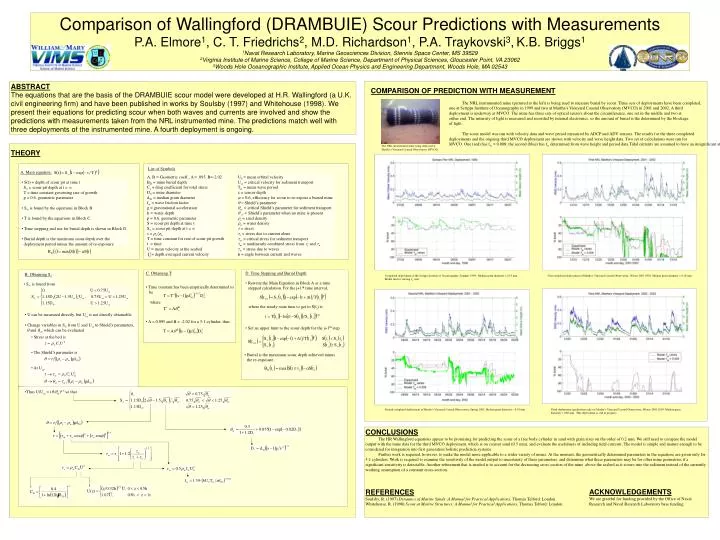
List of Symbols A, B = Geometric coeff., A = .095, B=-2.02 BD = mine burial depth Cr = drag coefficient for total stress D0 = mine diameter d50 = median grain diameter fw = wave friction factor g = gravitational acceleration h = water depth p = 0.6, geometric parameter S = scour pit depth at time t S = scour pit depth at t = s = rs /rw T = time constant for rate of scour pit growth t = time U = mean velocity at the seabed = depth averaged current velocity • Ub = mean orbital velocity • Ucr = critical velocity for sediment transport • Tw = mean wave period • z= sensor depth • a = 0.6, efficiency for scour to re-expose a buried mine q = Shield’s parameter qcr= critical Shield’s parameter for sediment transport q = Shield’s parameter when no mine is present • rs= sand density • rw= water density t= stress • tc = stress due to current alone • tcr = critical stress for sediment transport • tm = nonlinearly combined stress from tc and tw • tw = stress due to waves • = angle between current and waves B. Obtaining S: • S is found from • U can be measured directly, but Ucr is not directly obtainable • Change variables in Sfrom U and Ucr to Shield’s parameters, • q and qcr, which can be evaluated • Thus U/Ucr = (q/qcr)0.5 so that • Stress at the bed is • The Shield’s parameter is • At Ucr, Comparison of Wallingford (DRAMBUIE) Scour Predictions with Measurements P.A. Elmore1, C. T. Friedrichs2, M.D. Richardson1, P.A. Traykovski3,K.B. Briggs1 1Naval Research Laboratory, Marine Geosciences Division, Stennis Space Center, MS 39529 2Virginia Institute of Marine Science, College of Marine Science, Department of Physical Sciences, Gloucester Point, VA 23062 3Woods Hole Oceanographic Institute, Applied Ocean Physics and Engineering Department, Woods Hole, MA 02543 ABSTRACT The equations that are the basis of the DRAMBUIE scour model were developed at H.R. Wallingford (a U.K. civil engineering firm) and have been published in works by Soulsby (1997) and Whitehouse (1998). We present their equations for predicting scour when both waves and currents are involved and show the predictions with measurements taken from the NRL instrumented mine. The predictions match well with three deployments of the instrumented mine. A fourth deployment is ongoing. COMPARISON OF PREDICTION WITH MEASUREMENT The NRL instrumented mine (pictured at the left) is being used to measure burial by scour. Three sets of deployments have been completed, one at Scripps Institute of Oceanography in 1999 and two at Martha’s Vineyard Coastal Observatory (MVCO) in 2001 and 2002. A third deployment is underway at MVCO. The mine has three sets of optical sensors about the circumference, one set in the middle and two at either end. The intensity of light is measured and recorded by internal electronics, so the amount of burial is the determined by the blockage of light. The scour model was run with velocity data and wave period measured by ADCP and ADV sensors. The results for the three completed deployments and the ongoing third MVCO deployment are shown with velocity and wave height data. Two set of calculations were run for MVCO. One (red) has fw = 0.008; the second (blue) has fw determined from wave height and period data.Tidal currents are assumed to have an insignificant affect. THEORY The NRL instrumented mine being deployed at Martha’s Vineyard Coastal Observatory (MVCO). A. Main equation: • S(t) = depth of scour pit at time t • S = scour pit depth at t = • T = time constant governing rate of growth • p = 0.6, geometric parameter • S is found by the equations in Block B • T is found by the equations in Block C • Time stepping and use for burial depth is shown in Block D. • Burial depth is the maximum scour depth over the • deployment period minus the amount of re-exposure • C. Obtaining T: • Time constant has been empirically determined to • be D. Time Stepping and Burial Depth: Completed deployment at the Scripps Institute of Oceanography, Summer 1999. Median grain diameter = 0.19 mm. Model run for varying fw only. First completed deployment at Martha’s Vineyard Coastal Observatory, Winter 2001-2002. Median grain diameter = 0.18 mm. • Rewrite the Main Equation in Block A as a time stepped calculation. For the j+1th time interval, where where the steady-state time to get to S(tj) is • A = 0.095 and B = -2.02 for a 5:1 cylinder, thus • Set an upper limit to the scour depth for the j+1th step • Burial is the maximum scour depth achieved minus the re-exposure. Second completed deployment at Martha’s Vineyard Coastal Observatory, Spring 2002. Median grain diameter = 0.18 mm. Third deployment (predictions only) at Martha’s Vineyard Coastal Observatory, Winter 2002-2003. Median grain diameter = 0.60 mm. This deployment is still in progress. CONCLUSIONS The HR Wallingford equations appear to be promising for predicting the scour of a free body cylinder in sand with grain sizes on the order of 0.2 mm. We still need to compare the model output with the mine data for the third MVCO deployment, which is on coarser sand (0.5 mm), and evaluate the usefulness of including tidal currents. The model is simple and mature enough to be considered for integration into first generation holistic prediction systems. Further work is required, however, to make the model more applicable to a wider variety of mines. At the moment, the geometrically determined parameters in the equations are given only for 5:1 cylinders. Work is required to examine the sensitivity of the model output to uncertainty of these parameters, and determine what these parameters may be for other mine geometries if a significant sensitivity is detectable. Another refinement that is needed is to account for the decreasing cross-section of the mine above the seabed as it scours into the sediment instead of the currently working assumption of a constant cross-section. REFERENCES Soulsby, R. (1997) Dynamics of Marine Sands: A Manual for Practical Applications, Thomas Telford: London. Whitehouse, R. (1998) Scour at Marine Structures: A Manual for Practical Applications, Thomas Telford: London. ACKNOWLEDGEMENTS We are grateful for funding provided by the Office of Naval Research and Naval Research Laboratory base funding.