Download
1 / 49
490 likes | 575 Views
Empirical test of market efficiency of OMX options. Supervisor : Professor Lennart Flood Authors : Aijun Hou Aránzazu Muñoz Luengo. Agenda. 1. Background. 2. Theoretical Framework. 3. Methodology and Data. 4. Test of Market Efficiency.

E N D
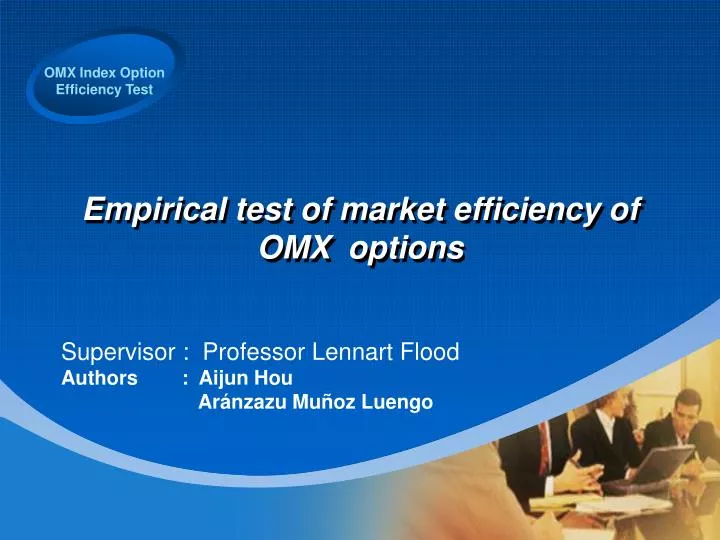
Empirical test of market efficiency of OMX options Supervisor : Professor Lennart Flood Authors : Aijun Hou Aránzazu Muñoz Luengo
Agenda 1. Background 2. Theoretical Framework 3. Methodology and Data 4. Test of Market Efficiency 5. Conclusion and Recommendation
1. Background 2. Theoretical Framework 3. Methodology and Data 4. Test of Market Efficiency 5. Conclusion and Recommendation
History of Option Market • Apr. 1973 CBOE • First Option Traded • 1983 CBOE • First Index Option Traded • 1986 Stockholm Stock Exchange • OMX Index Traded Index options give market participants the ability to participate in anticipated market movements, without having to buy or sell a large number of securities, and they permit portfolio managers to limit downside risk (Ackert & Tian, 1999)
Research Objective and Motivation • Objective : Efficiency test of OMX option market • Motivation : There is few paper examines OMX options Market
Option MarketEfficiency definition There is no arbitrage profit opportunities Or, there is capital constraints and arbitrageurs can not raise the capital necessary to form the risk-less hedging
Put Call Parity Violation?? Lower Boundary Violation?? Abnormal Return on Dynamic Hedging Simulation?? Three Hypothesis Efficient Market ??? OMX Option
1. Background 1. Background 2. Theoretical Framework 3. Methodology and Data 3. Methodology and Data 4. LB Test and PCP Test 4. LB Test and PCP Test 5. Dynamic Hedging Simulation 5. Dynamic Hedging Simulation 6. Conclusion and Recommendation 6. Conclusion and Recommendation
The Black Scholes Model Myron Scholes and Fischer Black, 1973 Replace Stock with Future F=Sert
Volatility • The relative rate at which the price of a security moves up and down • A Measure of Risk
Volatility Forecasting Methods • Historical Volatility (HSD) • Annualized Moving Average of Daily Return • WISD (Weight Implied Volatility) • Get Implied Volatility (IV) from the Market Price • Weight Average IV according to its sensitivity towards price changing
WISD Implied Volatility Smile: Solution: Weighting volatility across a number of options on the same underlying ( WISD)
WISD (con.) • Options more traded = More Market information • To adjust options’ sensitivities to the volatility • High price sensitivity options to σshould be given more weight
1. Background 2. Theoretical Framework 3. Methodology and Data 4. Test of Market Efficiency 5. Conclusion and Recommendation
Methodology • Lower Boundary Condition & Put Call • Parity condition • Dynamic Hedging Strategy • Paired T-Test
Data 1st June 1994—30th June 2004 OMX Index & Future OMX Index Option Risk Free Interest Rate Transaction Cost Trading date Time to maturity Ask Price Bid Price Close Price Volume Trading Date Time to maturity Ask Price Bid Price Close Price Volume Trading and Clear fee Commission fee Bid Ask Spread Other cost STIBOR
1. Background 1. Background 1. Background 2. Theoretical Framework 2. Theoretical Framework 2. Theoretical Framework 3. Methodology and Data 3. Methodology and Data 3. Methodology and Data 4. Test of Market Efficiency 5. Conclusion and Recommendation 5. Conclusion and Recommendation
Holding Equal Amount of Calls and Futures with Opposite Position Result Min. Profit (F-K)e-rt-C IF (F-K)e-rt-C>0 Then Profit Ensured C>= (F-K)e-rt Holding Equal Amount of Puts and Futures with Opposite Position Result Min. Profit (K-F)e-rt-P IF (K-F)e-rt-P>0 Then Profit Ensured P>= (K-F)e-rt Derivation of Lower Boundary
Consider Transaction Cost Consider Ask Bid Spread Revised Lower Boundary
Derivation of Put Call Parity It shows that the value of a EU call with a certain exercise price and exercise date can be deduced from the value of a EU put with the same exercise price and vice versa Without Bid Ask Spread With Bid Ask Spread Long Hedge Short Hedge
Filter Data • 0 or 0,01 ( Price & Volume) 360>T >0 High Bid Ask Spread Transaction Cost Fee (Fixed) Commission (Assumption) TC0 TC1 TC2 Refine Data
Empirical Results Violation Measured as : Frequency of Violation % = Number of Violations identified /Number of Observations Examined
Dynamic Hedging Test Design Filter Data Volatility Forecast Calculate BS Moddel Price Dynamic Hedging Simulation Market Price vs. Model Price Evaluate NPV
Dynamic hedging simulation Implementation Data filtration • 0 • ( Price & Volume) I(K-F)/K)I >10% T <7 or T>90 High Bid Ask Spread Liquidity & Non-synchronous problem
Dynamic hedging simulation Implementation Volatility Forecasting WISD HSD ui = LN(Si/Si-1) n= 20
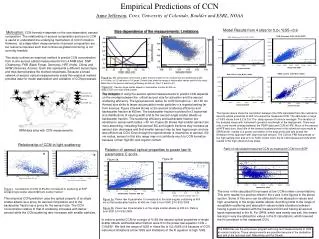
Result from WISD • WISD is in general higher than HSD • When the underlying asset market is getting extremely volatile, the derivative market tends to moderate it.
Result validity---Volatility Smile • Left skew pattern • Puts give higher volatility than calls
Result Validity—Term Structure • Term structure shows a downward slop • Consistent with Hull (2003) • Short-dated volatilities are historical high
Market Price vs. Model Price -Distribution of Price Differences
Market Price vs. Model Price -Moneyness Composition of Price Differences
Dynamic hedging simulation implementation • Spot Mispricings • Delta hedge ratio • Simulate Dynamic hedging
Result from Dynamic Hedging Slight Positive NPV when little cost considered Clearly Negative NPV when spread cost Considered
Little Put Call Parity Violation Little Lower Boundary Violation No Abnormal Return on Dynamic Hedging Simulation Conclusion Efficient Market ??? OMX Option
Recommendations • Intraday data • GARCH • Commission cost