Download
1 / 115
1.15k likes | 1.27k Views
Data Analysis State Accountability. Details. Index Framework Statutory Goal. 1. Improving Student achievement at all levels in the core subjects of the state curriculum. Index Framework Statutory Goal. 2. Ensuring the progress of all students toward achieving Advanced Academic Performance.

E N D
Index Framework Statutory Goal 1 Improving Student achievement at all levels in the core subjects of the state curriculum
Index Framework Statutory Goal 2 Ensuring the progress of all students toward achieving Advanced Academic Performance
Index Framework Statutory Goal 3 Closing Advanced Academic Performance level gaps among groups
Index Framework Statutory Goals 4 Closing gaps among groups in percentage of students graduating under the recommended high school program and advanced high school program
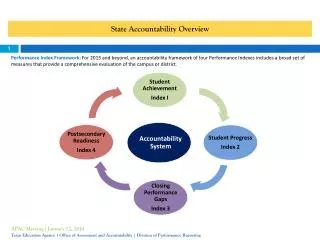
Why a Performance • Index ?
With a performance Index, the resulting rating reflects overall performancefor the campus or district rather than the weakest performanceof one student group/subject area.
Multiple indexes can be used in the frameworkto ensure accountability for every student.
Any number of indicators and student groups can be added to the system without creating additional targets for campuses and districts to meet.
Met Standard Met Alternative Standard Improvement Required
Index Standards Index Score 75 AEA-45 5th Percentile Index Score 55 AEA-30 Index Score 50 AEA-25
Student Groups… Economically Disadvantaged African American American Indian Asian Hispanic Pacific Islander White Two or more races English Language Learners Special Education
“Let Go” Keep Different
“Let Go” Keep Different Minimum Group Size 25 30/10/50 or 50/10/200
New Reports • Calculation Report-Tables used to aggregate scores to determine Index Points • Data Table- Table of disaggregated data used for the Calculation Report. The highlighted cells indicate data used in calculations.
Which student groups are calculated in Index 1? No Minimum Size 3 year average if less than 10 students
Index 1 :Student Achievement • Subjects: Combined over Reading, Mathematics, Writing, Science, and Social Studies. • Tests: STAAR English, STAAR Spanish, EOC, STAAR and EOC Modified and Alternate, TAKS Grade 11 • Performance Standards: Phase-in 1 Level II (2013) • MSR: None
# Met Phase in Level II for Reading # Met Phase in Level II for Writing # Met Phase in Level II for Math # Met Phase in Level II for Science # Met Phase in Level II for Social Studies # Tested Reading # Tested Writing # Tested Math # Tested Science # Tested Social Studies
What does the calculation report indicate about a campus? What would an Index score of 45 indicate about the campus?
What are the strengths and weaknesses of the campus based on the calculation report? What are your unanswered questions about this campus based on the calculation report? What reflective questions would you ask the campus about this data?
We do not know? Scores for : Did not Meet Expectations Met Expectations Exceeded Expectations The Index scores that identifies the lowest 5%
Subjects Reading Math Writing Applies to available grades
Student Groups All Students ELL Special Education White Hispanic Pacific Islander Asian American Indian Two or More Races African American
Minimum Size Criteria All Students = 10 tests Race/ Ethnicity groups = 25
Methodology Met- one point for each percent of students at the Met growth expectation level Exceeded- two points for each percent of students at the Exceeded growth expectations level