Download
1 / 6
60 likes | 166 Views
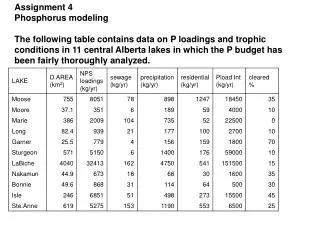
Assignment 4 Phosphorus modeling The following table contains data on P loadings and trophic conditions in 11 central Alberta lakes in which the P budget has been fairly thoroughly analyzed.

E N D
Assignment 4 Phosphorus modeling The following table contains data on P loadings and trophic conditions in 11 central Alberta lakes in which the P budget has been fairly thoroughly analyzed.
All P loading numbers are in kg/yr. NPS means non-point source loadings from the watershed. D. Area means drainage area. CLEARED % means the percentage of the watershed cleared for agriculture. PLOADint means internal P inputs from sediments (kg/yr). Inflow of water to the lake is in m3 x 106/yr. P-E refers to the difference between precipitation input and evaporation from the lake surface (m/yr). LAREA is the lake area in km2. MEAN D is mean depth in m, CHL A is the concentration of chlorophyll a in mg/m3, and TOTAL P is the total P concentration (dissolved + particulate) in mg/m3. Secchi is the transparency of the water in m.
1.For each lake calculate the Phosphorus export coefficient (g P/m2/yr). How do these values compare to those found in table 8-9 and 8-11 in your text? (5 marks) 2. Formulate a regression model predicting the P export coefficient from the percentage of the watershed that has been cleared for agriculture. How does the slope of the relationship compare to what you would expect from table 8-9? (6 marks) 3. Calculate the sedimentation constant (ksed) for each of the lakes in the data set.
4. Now calculate the fraction of the total load (external plus internal) that is exported downstream each year, and the fraction that is retained in the sediments. Graph ksed against the fraction retained, and calculate a regression equation predicting fraction retained from ksed. (11 marks) 5. Based on the data table and the regression model you calculated in part 2, and the ksed that you calculated in part 4, estimate using a single compartment mass balance model what the change in total P will be if the inputs from sewage and residences were removed, and the watershed was allowed to revert back to forest. Which lakes will change the most, which will change the least, and how much influence will internal loading have on the response of the lake to the proposed watershed changes? (6 marks)
6. Construct regression models predicting the concentration of Chlorophyll a in the lakes from the total P concentration, the total P loading, the total external load, and the total internal load. Which of these regression models will be most useful for predicting the new Chlorophyll a concentrations in the lake (i.e. following loading reduction)? Explain. (25 marks) 7. Construct a table showing the expected level of reduction in Chlorophyll a in each lake that you would expect to result from the changes described in question 5. Base this on your calculations of how much the total P should be reduced and the regression model in question 6 predicting Chl a from total P. Why are some of the lakes not predicted to undergo Chl a reduction following loading reductions, even though all are predicted to have lower total P. (5 marks)
8. Using a single compartment mass balance for total P (such as that presented in lectures), at equilibrium How do your estimates of the fraction retained and the fraction exported downstream, compare with these indices?