Download
1 / 8
80 likes | 277 Views
Then vs Now. 1978 / 1979 2006 52,000,000 REVENUES 467,500,000 1,000,000 NET INCOME 14,000,000 4,400,000 CASH FLOW 42,300,000 6,700,000 LONG-TERM DEBT 32,000,000 9,200,000 SHAREHOLDERS’ EQUITY 82,100,000 21,600,000 TOTAL ASSETS 208,100,000

E N D
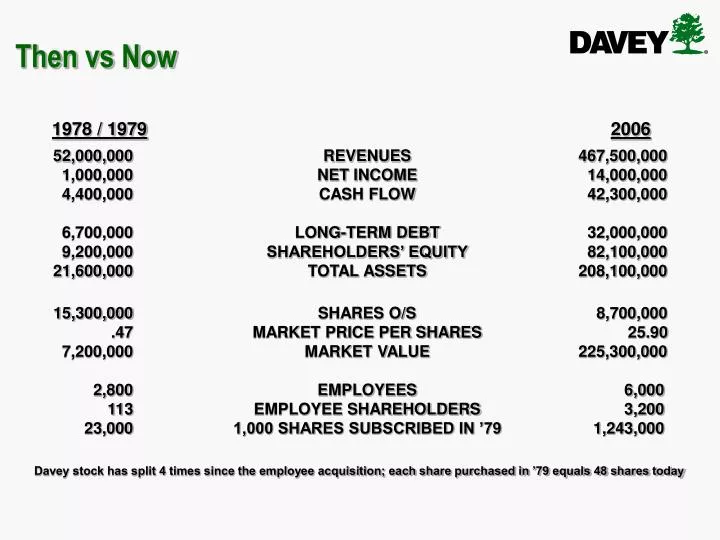
Then vs Now 1978 / 19792006 52,000,000 REVENUES 467,500,000 1,000,000 NET INCOME 14,000,000 4,400,000 CASH FLOW 42,300,000 6,700,000 LONG-TERM DEBT 32,000,000 9,200,000 SHAREHOLDERS’ EQUITY 82,100,000 21,600,000 TOTAL ASSETS 208,100,000 15,300,000 SHARES O/S 8,700,000 .47 MARKET PRICE PER SHARES 25.90 7,200,000 MARKET VALUE 225,300,000 2,800 EMPLOYEES 6,000 113 EMPLOYEE SHAREHOLDERS 3,200 23,000 1,000 SHARES SUBSCRIBED IN ’79 1,243,000 Davey stock has split 4 times since the employee acquisition; each share purchased in ’79 equals 48 shares today
‘79 Offering ‘89 Offering ‘02 Offering Down Payment 20% 10% 10% Subscription Term 6 Years 7 Years 7 Years Interest Rate 8% 8% 4.75% Minimum Shares 500 500 417 Minimum $ $11,250 $7,930 $5,000 # Employees 113 141 365 # Shares Sold 64,552 228,085 836,007 # of 1:2 Options -- -- 263,600 FMV $22.50 $15.86 $12.00 Total $ Sold $1,452,400 $3,617,400 $10,032,084 Employee Subscription Offering Key Data - ‘79, ‘89, ‘02 Offerings
Comparison 28-Year Cumulative Total Return Davey Dollars S&P Year
Stock Redemptions - # Shares1980-2006 ML Davey Jr. Option “Call” ’91 & Prior 9,311 ’92 - ’96 2,977 ‘97 - ‘01 2,797 ’02 - ‘06 2,514 Total 17,599 # Shares in Thousands
Stock Redemptions - $1980-2006 ’91 & Prior $20,351 ’92 - ’96 20,275 ‘97 - ‘01 37,323 ’02 - ‘06 43,596 Total $121,545 $14,238 ML Davey Jr. Option “Call” ML Davey Jr. Option “Call”
8,209 5,573 2,636 Shares Outstanding As of March 31, 2007 12,560 6,800 5,760 5,987
Summary of Outstanding Shares As of March 31, 2007 # Shares ShareholdersOutstanding% NON-ACTIVE Davey Family & Descendants 8 16,800 0.2 Retirees, Surviving Spouses & Descendants 132 1,319,245 16.0 Non-Retired Former Employees & Family 858 453,132 6.0 Outside 116 440,648 5.0 Total Non-Active 1,1142,229,82527.2% EMPLOYEES Vice Presidents & Directors (Officers) 30 1,413,597 17.0 Operations, Area & Corporate Managers 48 466,263 6.0 District & Account Managers 135 499,457 6.0 Corporate & Field Supervisors, Sales Representatives 101 243,224 3.0 All Others 941 720,271 9.0 Total Employees 1,2553,342,81241.0% Total Direct Shareholders 2,369 5,572,637 68.2% Total 401KSOP Accounts2,954 2,636,328 31.8% Less Duplications Above (802) Total All Shareholders 4,5218,208,965100.0%