Download

1 / 33
340 likes | 644 Views
prof. dr hab. med. Krzysztof Lewandowski. Myelodysplastic syndromes. Achievements in understanding and treatment. Classification of Myeloid Neoplasms According to the 2008 World Health Organization Classification Scheme. Myelodysplastic syndromes (MDS).

E N D
prof. dr hab. med. Krzysztof Lewandowski Myelodysplastic syndromes Achievements in understanding and treatment
Classification of Myeloid Neoplasms According tothe 2008 World Health Organization Classification Scheme
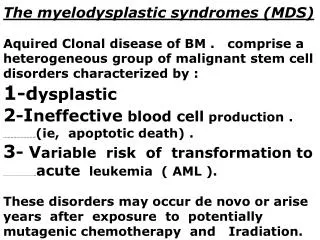
Myelodysplastic syndromes (MDS) • The myelodysplastic (MDS) are a veryheterogeneous group of myeloid disorderscharacterized by peripheral blood cytopenias and increased risk of transformation to acute myelogenous leukemia (AML)
Some of the deregulated pathways for the upregulated and downregulated genes in MDS CD34+ cells Li J. Int. J. Cancer: 000, 000–000 (2012)
Deregulated pathways in CD34ţ cells from MDS subtypes RA and RAEB2 compared with in healthy controls Li J. Int. J. Cancer: 000, 000–000 (2012)
Proposed mechanisms of miRNA in MDS pathogenesis Genetic and epigenetic abnormalities may occur in bothosteoblasts and HSCs, which result in the deregulation of certainmiRNAs in those cells. MiRNA deregulation is followed by thesubsequent abnormal expression of HSC extrinsic regulators inosteoblasts or HSC intrinsic regulators in HSCs, both leading toHSC dysfunction and MDS development Li J. Int. J. Cancer: 000, 000–000 (2012)
Frequency • In the US: The actual incidence is unknown. MDS was first considered a separate disease in 1976, and occurrence was estimated at 1500 new cases every year. At that time, only patients with less than 5% blasts were considered to have this disorder • Statistics from 1999 show that 13,000 new cases occur per year (approximately 1000 cases each year in children) • Internationally: The disease is found worldwide and is similar in characteristics throughout the world
Epidemiology • Sex:A slight male predominance is noted in all age groups. • Age:MDS primarily affects elderly people, with the median onset in the seventh decade of life. • The median age of these patients is 65 years, with ages ranging from the early third decade of life to older than 80 years. • The syndrome may occur in persons of any age group, including the pediatric population.
MDS diagnosis • Is based on morphological evidence of dysplasia upon visual examination of a bone marrow aspirate and biopsy • Information obtained from additional studies such as karyotype, flow cytometry, or molecular genetics is complementary but not diagnostic
MDS- diagnosis (2) • Aplastic anaemia and some disease accompanied by marrow dysplasia, including wit. B12 and/or folate deficiency, exposure to heavy metals, recent cytotoxic therapy and ongoing inflammation (including HIV and chronic liver disease/alcohol use) should be ruled out
MDS – clinical findings • These are non-specific, and are usually the consequences of cytopenias, including: • symptoms of anaemia • infections due to neutropenia, but also to the frequently associated defect in neutrophil function • bleeding due to thrombocytopenia (may also occur in moderately thrombocytopenic patients or even in patients with normal platelets count, because of its abnormal function)
WHO classification system Myelodysplastic syndromes Myelodysplastic syndromes: • Refractory anemia (RA) With ringed sideroblasts (RARS) Without ringed sideroblasts • Refractory cytopenia (MDS) with multilineage dysplasia (RCMD) • Refractory anemia with excess blasts (RAEB) • 5q- syndrome Myelodysplastic syndrome, unclassifiable • Myelodysplastic/Myeloprolipherative diseases • Chronic myelomonocytic leukemia (CMML) • Atypic chronic myelogenous leukemia (aCML)
WHO 2008 MDS classification Garcia-Manero G. Am. J. Hematol. 2011;86:491–498
IPSS risk-based classification system Myelodysplastic syndromes Marrow blast percentage: • < 5 0 • 5-10 0.5 • 11-20 1.5 • 21-30 2.0 Cytogenetic features • Good prognosis 0 (–Y, 5q- , 20q-) • Intermediate prognosis 0.5 (+8, miscellaneous singleabnormality, double abnormalities) • Poor prognosis 1.0 (abnor. 7, complex- >3 abnor.) Cytopenias • None or one type 0 • 2 or 3 type 0.5
Overall IPSS score and survival Myelodysplastic syndromes Overall score: Median survival: low • 0 5.7 years Intermediate • 1 (0.5 or 1) 3.5 years • 2 (1.5 or 2) 1.2 years High • > 2.5 0.4 years
Refined WHO Classification–Based Prognostic Scoring System (WPSS) of Myelodysplastic Syndromes Cazzola M et al. Semin Oncol 2011;38:627-634
Kaplan-Meier survival curves of 943 patientsdiagnosed with MDS according to the 2008 WHO criteria Cazzola M et al. Semin Oncol 2011;38:627-634
Myelodysplastic syndromes: 2011 update on diagnosis, riskstratification, and management American Journal of Hematology 2011; 86, 490-498, 18 MAY 2011 DOI: 10.1002/ajh.22047
Bone marrow biopsy • Blood examination and bone marrow aspirate are sufficient for a diagnosis of MDS • normal or increased cellularity is seen in 85-90% od cases • abnormal localization of immature precursors (ALIP) • fibrosis (significant in 15-20% of cases)
Frequency of cytogenetic alternations in MDS Garcia-Manero G. Am. J. Hematol. 2011;86:491–498
MDS therapyOptions for newly diagnosed patients with lower risk MDS • Therapy in this subset of patients is based on the transfusion needs of the patients • Patients that are transfusion independent are usually observed until they become transfusion dependent • Erythroid growth factor and granulocyte growth factor support (ESA, G-CSF) • Lenalidomide (is approved in the US for patients with lower risk MDS, anemia, and alteration of chromosome 5)
Management of progressive or refractory disease • At the present time, there are no approved interventions for patients with progressive or refractory disease particularly after hypomethylating based therapy. Options include cytarabine-based therapy, transplantation, and participation on a clinical trial.
Myelodysplastic syndromes: 2011 update on diagnosis, riskstratification, and management American Journal of HematologyVolume 86, Issue 6, pages 490-498, 18 MAY 2011 DOI: 10.1002/ajh.22047http://onlinelibrary.wiley.com/doi/10.1002/ajh.22047/full#fig2
Probability of survival after allogeneic transplant for MDS, age <20 years, by disease status and donor type, 1998-2008 100 100 90 90 80 80 70 70 60 60 50 50 40 40 30 30 20 20 10 10 0 0 Early, unrelated (N=145) Early, HLA-matched sibling (N=63) Advanced, HLA-matched sibling (N=114) Probability of Survival, % Advanced, unrelated (N=190) P = 0.002 1 3 0 2 4 5 6 Years SUM10_39.ppt
Probability of survival after allogeneic transplant for MDS, age ³20 years, by disease status and donor type, 1998-2008 100 100 90 90 80 80 70 70 60 60 50 50 40 40 30 30 20 20 10 10 0 0 Early, unrelated (N=509) Early, HLA-matched sibling (N=599) Probability of Survival, % Advanced, unrelated (N=1,142) Advanced, HLA-matched sibling (N=1,237) P < 0.0001 1 3 0 2 4 5 6 Years SUM10_40.ppt
Probability of survival after allogeneic transplant for MDS with reduced-intensity conditioning, by disease status and donor type, 1998-2008 100 100 90 90 80 80 70 70 60 60 50 50 40 40 30 30 20 20 10 10 0 0 Advanced, HLA-matched sibling (N=366) Early, HLA-matched sibling (N=217) Probability of Survival, % Early, unrelated (N=202) Advanced, unrelated (N=383) P < 0.0001 1 3 0 2 4 5 6 Years SUM10_41.ppt