Download
1 / 61
630 likes | 769 Views
5. MEASURING GDP AND ECONOMIC GROWTH. CHAPTER. Objectives. After studying this chapter, you will able to Define GDP and use the circular flow model to explain why GDP equals aggregate expenditure and aggregate income Explain the two ways of measuring GDP

E N D
5 MEASURING GDP AND ECONOMIC GROWTH CHAPTER
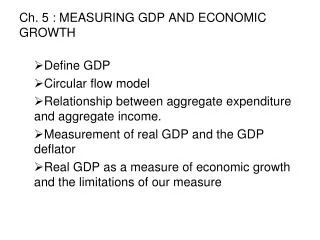
Objectives • After studying this chapter, you will able to • Define GDP and use the circular flow model to explain why GDP equals aggregate expenditure and aggregate income • Explain the two ways of measuring GDP • Explain how we measure real GDP and the GDP deflator • Explain how we use real GDP to measure economic growth and describe the limitations of our measure
An Economic Barometer • What exactly is GDP • How do we use it to tell us whether our economy is in a recession or how rapidly our economy is expanding? • How do we take the effects of inflation out of GDP to compare economic well-being over time • And how to we compare economic well-being across counties?
Gross Domestic Product • GDP Defined • GDP or gross domestic product, is the market value of all final goods and services produced in a country in a given time period. • This definition has four parts: • Market value • Final goods and services • Produced within a country • In a given time period
Gross Domestic Product • Market value • GDP is a market value—goods and services are valued at their market prices. • To add apples and oranges, computers and popcorn, we add the market values so we have a total value of output in dollars.
Gross Domestic Product • Final goods and services • GDP is the value of the final goods and services produced. • A final good (or service), is an item bought by its final user during a specified time period. • A final good contrasts with an intermediate good, which is an item that is produced by one firm, bought by another firm, and used as a component of a final good or service. • Excluding intermediate goods and services avoids double counting.
Gross Domestic Product • Produced within a country • GDP measures production within a country—domestic production. • In a given time period • GDP measures production during a specific time period, normally a year or a quarter of a year.
Gross Domestic Product • GDP and the Circular Flow of Expenditure and Income • GDP measures the value of production, which also equals total expenditure on final goods and total income. • The equality of income and output shows the link between productivity and living standards. • The circular flow diagram in Figure 21.1 illustrates the equality of income, expenditure, and the value of production.
Gross Domestic Product • The circular flow diagram shows the transactions among households, firms, governments, and the rest of the world
Gross Domestic Product • These transactions take place in factor markets, goods markets, and financial markets.
Gross Domestic Product • Firms hire factors of production from households. The blue flow, Y, shows total income paid by firms to households.
Gross Domestic Product • Households buy consumer goods and services. The red flow, C, shows consumption expenditures.
Gross Domestic Product • Households save, S, and pay taxes, T. Firms borrow some of what households save to finance their investment.
Gross Domestic Product • Firms buy capital goods from other firms. The red flow I represents this investment expenditure by firms.
Gross Domestic Product • Governments buy goods and services, G, and borrow or repay debt if spending exceeds or is less than taxes
Gross Domestic Product • The rest of the world buys goods and services from us, X and sells us goods and services, M—net exports are X - M
Gross Domestic Product • And the rest of the world borrows from us or lends to us depending on whether net exports are positive or negative.
Gross Domestic Product • The blue and red flows are the circular flow of expenditure and income. The green flows are borrowing and lending.
Gross Domestic Product • The sum of the red flows equals the blue flow.
Gross Domestic Product • That is: Y = C + I + G + X - M
Gross Domestic Product • The circular flow demonstrates how GDP can be measured in two ways. • Aggregate expenditure • Total expenditure on final goods and services, equals the value of output of final goods and services, which is GDP. • Total expenditure = C + I + G + (X – M).
Gross Domestic Product • Aggregate income • Aggregate income earned from production of final goods, Y, equals the total paid out for the use of resources, wages, interest, rent, and profit. • Firms pay out all their receipts from the sale of final goods, so income equals expenditure, • Y = C + I + G + (X – M).
Gross Domestic Product • Financial Flows • Financial markets finance deficits and investment. • Household saving S is income minus net taxes and consumption expenditure, and flows to the financial markets; • Y = C + S + T, • income equals the uses of income.
Gross Domestic Product • If government purchases exceed net taxes, the deficit (G – T) is borrowed from the financial markets (if T exceeds G, the government surplus flows to the markets). • If imports exceed exports, the deficit with the rest of the world (M – X) is borrowing from the rest of the world.
Gross Domestic Product • How Investment Is Financed • Investment is financed from three sources: • Private saving, S • Government budget surplus, (T – G) • Borrowing from the rest of the world (M – X).
Gross Domestic Product • We can see these three sources of investment finance by using the fact that aggregate expenditure equals aggregate income. • Start with • Y = C + S + T = C + I + G + (X – M). • Then rearrange to obtain • I = S + (T – G) + (M – X) • Private saving S plus government saving (T – G) is called national saving.
Gross Domestic Product • Gross and Net Domestic Product • “Gross” means before accounting for the depreciation of capital. The opposite of gross is net. • To understand this distinction, we need to distinguish between flows and stocks in macroeconomics. • A flow is a quantity per unit of time; a stock is the quantity that exists at a point in time.
Gross Domestic Product • Wealth, the value of all the things that people own, is a stock. Saving is the flow that changes the stock of wealth. • Capital, the plant, equipment, and inventories of raw and semi-finished materials that are used to produce other goods and services is a stock. • Investment is the flow that changes the stock of capital. • Depreciation is the decrease in the capital stock that results from wear and tear, and obsolescence. • Capital consumption is another name for depreciation.
Gross Domestic Product • Gross investment is the total amount spent on purchases of new capital and on replacing depreciated capital. • Net investment is the change in the stock of capital and equals gross investment minus depreciation.
Gross Domestic Product • Figure 21.2 illustrates the relationships among capital, gross investment, depreciation, and net investment.
Gross Domestic Product • Gross profits, and GDP, include depreciation. • Similarly, gross investment includes that amount of purchases of new capital goods that replace depreciation • Net profits, net domestic product, and net investment subtract depreciation from the gross concepts. • Investment plays a central role in the economy. Increases in capital are one source of growth in potential real GDP; fluctuations in investment are one source of fluctuations in real GDP.
Measuring U.S. GDP • The Bureau of Economic Analysis uses two approaches to measure GDP • The expenditure approach • The income approach
Measuring U.S. GDP • The Expenditure Approach • The expenditure approach measures GDP as the sum of consumption expenditure, investment, government purchases of goods and services, and net exports. • Table 21.1 in the textbook shows the expenditure approach with data for 2003.
Measuring U.S. GDP • The Income Approach • The income approach measures GDP by summing the incomes that firms pay households for the factors of production they hire.
Measuring U.S. GDP • The National Income and Product Accounts divide incomes into five categories • Compensation of employees • Net interest • Rental income • Corporate profits. • Proprietors’ income. • The sum of these five income components is net domestic income at factor cost.
Measuring U.S. GDP • Two adjustments must be made to get GDP • Indirect taxes minus subsidies are added to get from factor cost to market prices. • Depreciation (or capital consumption) is added to get from net domestic product to gross domestic product. • Table 21.2 in the textbook shows the income approach with data for 2003.
Real GDP and the Price Level • Real GDP is the value of final goods and services produced in a given year when valued at constant prices. • Calculating Real GDP • The first step in calculating real GDP is to calculate nominal GDP, which is the value of goods and services produced during a given year valued at the prices that prevailed in that same year.
Real GDP and the Price Level • The table provides data for 2002 and 2003. • In 2002, nominal GDP is: • Expenditure on balls $100 • Expenditure on bats $100 • Nominal GDP $200
Real GDP and the Price Level • In 2003, nominal GDP is: • Expenditure on balls $80 • Expenditure on bats $495 • Nominal GDP $575
Real GDP and the Price Level • The old method of calculating real GDP was to value each year’s output at the prices of a base year—the base year prices method. • Suppose 2002 is the base year and 2003 is the current year.
Real GDP and the Price Level • Expenditure on balls in 2003 valued at 2002 prices is $160. • Expenditure on bats in 2003 valued at 2002 prices is $110. • Real GDP in 2003 (base-year prices method) is $270.
Real GDP and the Price Level • The new method of calculating real GDP, which is called the chain-weighted output index method, uses the prices of two adjacent years to calculate the real GDP growth rate. • This calculation has four steps described on the next slide.
Real GDP and the Price Level • Step 1: Value last year’s production and this year’s production at last year’s prices and then calculate the growth rate of this number from last year to this year. • Step 2: Value last year’s production and this year’s production at this year’s prices and then calculate the growth rate of this number from last year to this year. • Step 3: Calculate the average of the two growth rates. This average growth rate is the growth rate of real GDP from last year to this year. • Step 4: Repeat steps 1, 2, and 3 for each pair of adjacent years to link real GDP back to the base year’s prices.
Real GDP and the Price Level • We’ve done step 1. • 2002 production at 2002 prices (GDP in 2002) is $200. • 2003 production at 2002 prices is $270. • The 2003 growth rate in 2002 prices is 35 percent.
Real GDP and the Price Level • Step 2. • 2002 production at 2003 prices is $500. • 2003 production at 2003 prices (GDP in 2003) is $575. • The 2003 growth rate in 2003 prices is 15 percent.
Real GDP and the Price Level • Step 3. • The 2003 growth rate in 2002 prices is 35 percent. • The 2003 growth rate in 2003 prices is 15 percent. • The average of these two growth rates is 25 percent. • Real GDP in 2003 with 2002 as the base year is $250.
Real GDP and the Price Level • Step 4. • Because we’re calculating real GDP in 2003 at 2002 prices, step 4 is completed! • Real GDP in 2002 is $200 • Real GDP in 2003 is $250
Real GDP and the Price Level • Calculating the Price Level • The average level of prices is called the price level. • One measure of the price level is the GDP deflator, which is an average of the prices of the goods in GDP in the current year expressed as a percentage of the base year prices. • The GDP deflator is calculated in the table on the next slide (and in Table 21.7 in the textbook).
Real GDP and the Price Level • Nominal GDP and real GDP are calculated in the way that you’ve just seen. • GDP Deflator = (Nominal GDP/Real GDP) 100. • In 2002, the GDP deflator is ($200/$200) 100 = 100. • In 2003, the GDP deflator is ($575/$250) 100 = 230.
Real GDP and the Price Level • Deflating the GDP Balloon • Nominal GDP increases because production—real GDP– increases.