Download
1 / 50
500 likes | 618 Views
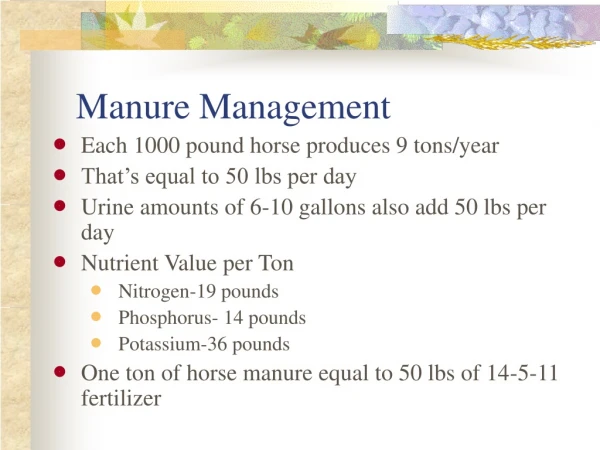
Community Manure Management Feasibility Study Dane County, Wisconsin Summary Presentation February 1, 2008. Upper Mendota Watershed. High P Soils. Low P Soils. Base map courtesy of Dane County Land Information Office. The Upper Mendota Watershed has a Long History in Agriculture.

E N D
Community Manure Management Feasibility Study Dane County, Wisconsin Summary Presentation February 1, 2008
Upper Mendota Watershed High P Soils Low P Soils Base map courtesy of Dane County Land Information Office The Upper Mendota Watershed has a Long History in Agriculture
Agricultural Viability & Sustainability Viable Alternatives Water Quality Protection Economic Feasibility Project Goals were Crafted Early to Direct the Project
Survey area farmers Select farm clusters Identify and select management alternatives Evaluate technologies and economics Evaluate nonmonetary aspects Research potential financing/funding opportunities Describe potential ownership and operation models Develop conclusions and recommendations Project Scope Followed Logically from Goal Development
Determine whether any alternatives could feasibly meet the major goals Identify potential opportunities and preliminary assessments Identify data gaps and significant unknowns Identify next steps Increased detail - reduced unknowns Feasibility Studies are Not Designed to Provide Firm Answers!
Project’s Uniqueness Results from the County’s Nutrient Management Goals Agricultural Viability & Sustainability Economic Feasibility
Water Quality Protection Project’s Uniqueness Results from the County’s Nutrient Management Goals Agricultural Viability & Sustainability Economic Feasibility
Survey was Developed to Collect Manure Management Data Task 1 - Survey Development & Data Collection
41 of 117 Farmers Responded to our Survey Task 1- Survey Development & Data Collection
Waunakee Cluster • 3 farms • Close proximity • 3,145 A.U. • Pump manure • Middleton Cluster • 7 farms • Further apart • 3,813 A.U. • Haul manure Cluster Selection - Location and Responses Task 2 - Cluster Selection
Technology Shortlist was Developed to Meet the Following Criteria • P reduction of 40 percent, minimum. • Proven at full-scale or at least long‑term pilot scale. • Individual Farm – 500 A.U. • Waunakee Cluster – 3,145 A.U. • Middleton Cluster – 3,813 A.U. • Increase by anticipated growth + 25% Task 3 – Identify and Select Management Alternatives
Mechanical solids separation with polymer Single farm (F-1) and clusters (C-1W and C-1M) ~45% P reduction Shortlist - 5 Technologies/Approaches ~45% of P in solids Task 3 – Identify and Select Management Alternatives
Mechanical solids separation with ferric and polymer Single farm and clusters (F-2, C-2W and C-2M) ~85% P reduction Shortlist - 5 Technologies/Approaches ~85% of P in solids Task 3 – Identify and Select Management Alternatives
Anaerobic Digestion with solids separation Single farm and clusters (F-3, C-3W and C-3M) ~85% P reduction Energy production Shortlist - 5 Technologies/Approaches Ferric ~85% of P in solids Electricity and Heat Task 3 – Identify and Select Management Alternatives
Solids separation followed by Drying Clusters only (C-4W and C-4M) ~90% P reduction Almost all water removed from solids Shortlist - 5 Technologies/Approaches Ferric ~90% of P in solids Task 3 – Identify and Select Management Alternatives
Incineration Clusters only (C-5W and C-5M) 100% P reduction (and other nutrients) No water returned to land Shortlist - 5 Technologies/Approaches Steam Electrical Generation Manure Burner and Boiler Drying Ash 100% of P Task 3 – Identify and Select Management Alternatives
Single Waunakee Middleton AlternativeFarmClusterCluster Alt. 1 – Solids Separation F-1 C-1W C-1M Alt. 2 – Solids Sep. + Ferric F-2 C-2W C-2M [Alt. 1 + Chem. P removal] Alt. 3 – An. Digestion + Solids Sep. F-3 C-3W C-3M [AD + Alt. 2] Alt. 4 – Solids Sep. + Drying C-4W C-4M [Alt. 2 + Drying] Alt. 5 – Incineration C-5W C-5M Summary of Technical Alternatives Task 3 – Identify and Select Management Alternatives
Technical & Economic Evaluations Task 4 – Technical Economic Evaluations
AlternativeP Removed (%) Capital Costs Total Per Current A.U.Per Design A.U. Individual Farma F-1 45% $1,426,000 $2,850 $2,130 F-2 85% $1,685,000 $3,370 $2,510 F-3 85% $2,840,000 $5,680 $4,240 Waunakee Clusterb C-1W 45% $6,423,000 $2,040 $1,500 C-2W 85% $8,415,000 $2,680 $1,960 C-3W 85% $11,495,000 $3,660 $2,680 C-4W 90% $13,507,000 $4,300 $3,150 C-5W 100% $11,333,000 $3,600 $2,640 Middleton Clusterc C-1M 45% $5,127,000 $1,340 $1,030 C-2M 85% $8,215,000 $2,150 $1,660 C-3M 85% $10,934,000 $2,870 $2,210 C-4M 90% $13,247,000 $3,470 $2,670 C-5M 100% $10,319,000 $2,710 $2,080 a Current A.U. = 500; design A.U. = 669. b Current A.U. = 3,145; design A.U. = 4,293. c Current A.U. = 3,813; design A.U. = 4,957. $630 $1,100 $470 Opinion of Capital Cost Summary Task 4 – Technical Economic Evaluations
AlternativeP Removed(%) Capital Costs Total Per Current A.U.Per Design A.U. Individual Farma F-1 45% $1,426,000 $2,850 $2,130 F-2 85% $1,685,000 $3,370 $2,510 F-3 85% $2,840,000 $5,680 $4,240 Waunakee Clusterb C-1W 45% $6,423,000 $2,040 $1,500 C-2W 85% $8,415,000 $2,680 $1,960 C-3W 85% $11,495,000 $3,660 $2,680 C-4W 90% $13,507,000 $4,300 $3,150 C-5W 100% $11,333,000 $3,600 $2,640 Middleton Clusterc C-1M 45% $5,127,000 $1,340 $1,030 C-2M 85% $8,215,000 $2,150 $1,660 C-3M 85% $10,934,000 $2,870 $2,210 C-4M 90% $13,247,000 $3,470 $2,670 C-5M 100% $10,319,000 $2,710 $2,080 a Current A.U. = 500; design A.U. = 669. b Current A.U. = 3,145; design A.U. = 4,293. c Current A.U. = 3,813; design A.U. = 4,957. $550 $850 $300 Opinion of Capital Cost Summary (cont.) Task 4 – Technical Economic Evaluations
AlternativeP Removed(%) Capital Costs Total Per Current A.U.Per Design A.U. Individual Farma F-1 45% $1,426,000 $2,850 $2,130 F-2 85% $1,685,000 $3,370 $2,510 F-3 85% $2,840,000 $5,680 $4,240 Waunakee Clusterb C-1W 45% $6,423,000 $2,040 $1,500 C-2W 85% $8,415,000 $2,680 $1,960 C-3W 85% $11,495,000 $3,660 $2,680 C-4W 90% $13,507,000 $4,300 $3,150 C-5W 100% $11,333,000 $3,600 $2,640 Middleton Clusterc C-1M 45% $5,127,000 $1,340 $1,030 C-2M 85% $8,215,000 $2,150 $1,660 C-3M 85% $10,934,000 $2,870 $2,210 C-4M 90% $13,247,000 $3,470 $2,670 C-5M 100% $10,319,000 $2,710 $2,080 a Current A.U. = 500; design A.U. = 669. b Current A.U. = 3,145; design A.U. = 4,293. c Current A.U. = 3,813; design A.U. = 4,957. $1,560 $2,030 $470 Opinion of Capital Cost Summary (cont.) Task 4 – Technical Economic Evaluations
The cluster alternatives are considerably less expensive than the individual farm alternatives when compared on the bases of “$ per animal unit” for similar technologies (e.g., F-3 with C-3W/C-3M) Potential to save $600 - $2,000/A.U. with cluster concept The Middleton Cluster has lower “per A.U.” capitalcosts than the Waunakee Cluster Result of the pumping and piping infrastructure included in the Waunakee Cluster and not in the Middleton Cluster Capital Cost Summary and Conclusions
Annual O&M Costs/Revenue Task 4 – Technical Economic Evaluations
Annual O&M Costs/Revenue (cont.) Task 4 – Technical Economic Evaluations
Annual O&M Costs/Revenue (cont.) Task 4 – Technical Economic Evaluations
Annual O&M Costs/Revenue (cont.) Task 4 – Technical Economic Evaluations
Annual O&M Costs/Revenue (cont.) Task 4 – Technical Economic Evaluations
For the individual farm alternatives, only Alternative F‑2 (Fine solids removal with polymer and ferric addition) appears to lower annual O&M costs significantly compared to the existing O&M cost opinions. For the cluster alternatives, the Waunakee cluster appears to have significantly lower annual O&M costs than the Middleton cluster Pumping rather than trucking O&M Cost Summary and Conclusions Task 4 – Technical Economic Evaluations
Waunakee Cluster: All alternatives except C-1W (solids separation) and C-4W (drying) are anticipated to lower annual O&M costs significantly compared to the existing farms’ O&M costs: Alternative C-1W still requires trucking Alternative C‑4W has a high annual cost for natural gas Energy recovery options (C‑3W and C‑3M) appear to generate a net revenue: Sale of solids Electricity buy-back Greenhouse gas (GHG) emission reduction credits O&M Cost Summary and Conclusions Task 4 – Technical Economic Evaluations
Middleton Cluster: Energy recovery Alternatives (C‑3M and C‑5M) appear to lower annual O&M costs significantly compared to the existing farms’ O&M costs. None of the alternatives appear to generate a net revenue. O&M Cost Summary and Conclusions Task 4 – Technical Economic Evaluations
O&M Cost Summary and Conclusions Phosphorus Reductions: Task 4 – Technical Economic Evaluations
Value of Energy: Waunakee Cluster: Alt. C-3W (An. Digestion): 9,700 kWh/day (415 homes) Alt. C-5W (Incineration): 13,100 kWh/day (560 homes) Middleton Cluster Alt. C-3M (An. Digestion): 7,300 kWh/day (313 homes) Alt. C-5M (Incineration): 9,800 kWh/day (420 homes) O&M Cost Summary and Conclusions Task 4 – Technical Economic Evaluations
O&M Cost Summary and Conclusions Green House Gas Reductions (Waunakee Cluster): • ~19,800 metric tons/CO2-equiv./year reduction: • 3,800 homes @ 700 kWh/month of electricity • 1 kWh of electricity ~ 1.37 lbs CO2 • 3,900 homes @ 80 therms of natural gas/month • 1 MMBTU of natural gas ~ 117 lbs CO2 • Driving approximately 50 million miles/year @ average fuel economy of 25 miles/gallon • 1 gallon of gasoline ~ 21.7 lbs CO2 Task 4 – Technical Economic Evaluations
Sensitivity Analyses: Manure/returned liquids hauling costs Fuel costs Land availability and costs Labor costs Environmental regulation for land application Solids disposal revenue (or cost) Is there a market for reuse? Is this a cost rather than a revenue? GHG emission reduction credits Requires thorough research and planning Which market/program is best suited for the long-term? O&M Cost Summary and Conclusions Task 4 – Technical Economic Evaluations
Phosphorus Reduction Water Quality Impacts Air Quality Impacts Maintaining Green Space/Water Quantity Maintaining Working Farmland/Culture Nutrient Transportability Greenhouse Gases and Potential Credits Production of Renewable Energy Aesthetics/Nuisances Safety Issues - Farm/Commuter Traffic Impact on Roads/Truck Traffic Animal Disease Control Status of Technology; Reliability Ease of Operation Expandability Ability to Treat Other Feedstocks Regulatory and Permitting Issues Image of Dane County -Sustainability Leader Nonmonetary Evaluations * * * Task 5 – Nonmonetary Evaluations
Nonmonetary Score (weighted) Single AlternativeFarmCluster Alt. 1 – Solids Separation 38 36 Alt. 2 – Solids Sep. + Ferric 50 45 Alt. 3 – An. Digestion + Solids Sep. 61 73 Alt. 4 – Solids Sep. + Drying 37 Alt. 5 – Incineration 37 Nonmonetary Scores
Dependent on farmer vs. government vs. 3rd party ownership Dynamic funding programs (loans, grants) and financial aid Project financing and funding is a major unknown Can be better defined once project scope is refined Financing/Funding Opportunities Task 6 – Financing/Funding Opportunities
Ownership and Operation Models Task 7 – Ownership and Operation Models
Ownership and Operation Models Task 7 – Ownership and Operation Models
Ownership and Operation Models Task 7 – Ownership and Operation Models
Ownership and Operation Models Task 7 – Ownership and Operation Models
Ownership and Operation Models Task 7 – Ownership and Operation Models
Ownership and Operation Models Task 7 – Ownership and Operation Models
The Dane County farming community is interested in developing manure management strategies. Currently many Dane County farms have long hauling distances and need to rent land for land application of the manure. Water quality impacts from land application of manure has been shown to be significant, and manure is a major source of phosphorus loading (and other nutrient loading) within the Upper Lake Mendota Watershed. Conclusions Task 8 – Conclusions and Recommendations
Cluster manure management strategies appear to offer significant economies of scale with respect to capital costs compared to the individual farm systems when compared on a “per A.U.” basis. Several of the cluster management strategies have significantly lower annual O&M cost projections (per A.U. basis) than the existing annual O&M costs at the farms especially energy recovery alternatives (C-3 and C-5) Conclusions Task 8 – Conclusions and Recommendations
The Waunakee Cluster strategies have higher capital costs and lower O&M costs compared to the Middleton Cluster as the result of manure pumping versus hauling. The Waunakee Cluster alternatives appear to offer more advantages and better long-term cost-effectiveness than the Middleton Cluster alternatives or individual farm alternatives. After additional review, additional farms may be able to join the Waunakee Cluster, and other clusters may be able to be defined and refined. Likely that combination pumping and hauling is feasible. Conclusions Task 8 – Conclusions and Recommendations
Continue discussions and information exchange with area Dane County farmers to assess on-going interest and promote community solutions. At the County level, determine what level of financial commitment is reasonable to invest in the additional planning, design, and ultimate construction of a manure management strategy. At the County level, discuss and determine whether such a facility could or should be owned and operated by the County. This may be affected by the level of interest in ownership among farmers Recommendations Task 8 – Conclusions and Recommendations
Conduct a Facility Planning Study to further refine and develop the scope of select alternatives and strategies: Identifying site locations Verifying manure quantities and other potential feedstocks Develop preliminary layout(s) of alternatives and more accurate cost opinions (capital and O&M) Conduct a detailed analysis of overall manure management practices on the affected farms. Ownership of the facility Operation of the facility Funding programs Recommendations Task 8 – Conclusions and Recommendations
Define agronomic and related crop management impacts that would result from a manure management facility, and include such impacts in the facility planning analyses. Continue to investigate funding and financing opportunities for manure management facilities. Investigate potential GHG emission reduction credits in more detail and determine what additional steps are needed to obtain maximum credit for such a project. Evaluate the capital and O&M costs from actual full-scale operations in the United States, and estimate how those costs may translate to a similar operation in Dane County. Recommendations Task 8 – Conclusions and Recommendations
Community Manure Management Feasibility Study Dane County, Wisconsin Summary Presentation February 1, 2008