Download
1 / 46
460 likes | 688 Views
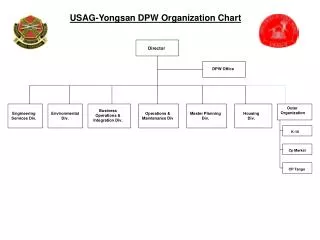
Drought Management. CRIDA. Y.S. Ramakrishna Director. Central Research Institute for Dryland Agriculture Santosh Nagar, Hyderabad – 500 059. Probability of drought occurrence. Probability of occurrence of severe droughts. Impacts of drought. Environmental. Societal. Social.

E N D
Drought Management CRIDA Y.S. Ramakrishna Director Central Research Institute for Dryland Agriculture Santosh Nagar, Hyderabad – 500 059
Impacts of drought Environmental Societal Social • Moisture stress • Drinking water shortage • Degradation of resources • Increased pollution • (both air and water) • Malnutrition • Ill-health • Migration • Debts Economic • Fall in Ag. Production • Reduced income • Loss of livestock • Fall in output • Unemployment • Shortage of essential goods
METHODOLOGIES FOR ASSESSMENT
Methodologies Aridity Anomaly Index (AI) • This index is calculated on the basis of Thornthwait’s water balance. • This is the ratio of water deficit (PET-AET) to water need (PET). • The departure of the index from the normal expressed as percentage of the normal is called Aridity Anomaly index.
Methodologies • Palmer Drought Severity Index (PDSI) • This index is based on a two layer water balance model. • He introduced the concept of CAFEC (Climatically Appropriate For Existing Conditions) precipitation which is a normal value for the established human activities of the place. • The anomaly between actual and CAFEC rainfall is used as a drought indicator. • To make this anomaly comparable is space and time, it is multiplied by a weighting factor K which depends on average moisture demand and supply and mean of the absolute values of the anomaly of the place. • He devised a scale which ranged from –4 to +4 on the basis of which droughts were classified.
Methodologies Soil Moisture Deficit Index (SMDI) • This index is based on crop specific soil water balance model. • Soil moisture deficit ratio is calculated for a given period based on long term mean soil moisture, maximum and minimum available soil water. • SMDI is calculated following Palmer’s (1965) procedure. • This index can be classified into specific ranges as in the case of PDSI.
Methodologies Standard Precipitation Index (SPI) • Two parameter incomplete gamma distribution is fitted to the long term rainfall data to normalize the series. • The cumulative probabilities are then transformed into standardized normal variables with mean of zero and standard deviation of one using inverse normal distribution, so the values of the SPI are in standard deviations. • Positive values indicate greater than median precipitation and negative values indicate less than median precipitation. • Being independent of the magnitude of mean rainfall, it is comparable over a range of climatic zones.
Methodologies Comparison of different indices
Other drought indices • R index R/PE less than 0.40 • Z index (R-Rca).w • WRSI (FAO) WD/ TWR *100 • SDD Tc-Ta • NDVI (IR-R)/(IR+R)
Types of Agricultural Droughts Early season: Delayed onset, prolonged dry spells after onset Mid-season: Inadequate soil moisture between two rain events Late season: Early cessation of rains or insufficient rains
Agricultural drought classification S = Seedling; V = Vegetative; R = Reproductive S1V3R2 = A2 (moderate) S0V1R1 = A1 (mild) Source: Ramanarao et al, 1981
Drought Management A Case Study from Andhra Pradesh: Approach
Methodologies • Criteria for identification of drought affected areas • Various states have been following different norms for the declaration of drought. • For example: • In A.P. following criteria has been used • Deficiency of rainfall • Deficiency of rainfall of 25% and above in Mandals where the annual rainfall is more than 1000 mm. • 20% and above, where the annual rainfall is 750 mm – 1000 mm. • 15% and above where the annual rainfall is less than 750 mm.
Methodologies Any two of the remaining norms • Compression / reduction in the cropped area of 50% and above under all principal crops. • Normal reduction in crop yields of 50% and above in comparison with average yields of preceding 5 years. • Dry spell and its impact on crops.
Parameters considered for prioritization of mandals for taking of drought mitigation activity 1.Average Rainfall 2. Coefficient of variation of rainfall 3. Meteorological drought frequency 4. Hydrological drought frequency 5. Agricultural drought frequency 6. Ground Water Status 7. Feed and Fodder availability 8. Percent Irrigated Area (Kharif) 9. Percent Irrigated Area (Rabi) 10. Rural Water Supply (percent habitations fully covered) 11. Drought Severity (agriculture) Note: 1. The developmental / relief measures should be given preference as for the priority. The Priority I mandals should get maximum preference and Priority IV the least. 2. The ranks given to the individual parameters are flexible and the user has the option to change theranks by using the Ranking Software. 3. Most of the mandals fall under Priority II and Priority III categories
Forewarning Software INPUT 1. Rainfall 2. Pan evaporation (mm) maximum and minimum temperature (if pan evaporation is not available i.e. for calculation of potential evapotranspiration) 3. Crop coefficient 4. Yield response factor 5. Available water holding capacity (AWC) of the soil 6. Latitude and longitude of the mandal (if pan evaporation is not available) 7. Maximum yield of crop 8. Duration of the crop OUTPUT 1. Soil moisture 2. Runoff 3. Deep drainage 4. Moisture adequacy index 5. Water requirement satisfaction index 6. Yield compared to normal 7. Drought signals
Drought Signal If MAI on any day is less than 0.75 it gives ALARM If number of days with MAI < 0.75 is 10 ↓ Gives signal 1 i.e. mild drought signal If number of days with MAI < 0.75 is 20 ↓ If number of days with MAI <0.5. is 10 ↓ Gives signal 2 i.e. moderate drought If number of days with MAI <0.75 is 30 If number of days with MAI < 0.50 is 20 ↓ If number of days with MAI 0.25 is 10 Gives signal 3 i.e. severe drought
Drought Mitigation Strategies • Policy support at national and state level • Developmental funding to rural development and special assistance during natural calamities • Input supply, access to credit and marketing and price support • Farm advisory services • Non-Government Agencies like: • NGO, CBO, SHG, Philanthropic bodies and aid agencies • Major focus: • Education, building of awareness creation and community institutions and leadership • Supplementing the Government effort in rural development
Short-term/Immediate measures • Execution of labour-oriented schemes for employment generation and implementation of relief and development works – National Rural Employment Guarantee Act (NREGA) programme • Good weather code – encashing production from good rainfall regions and managing low rainfall regions through transport of food grains from high production areas • Establishment of Fodder/Seed/Grain banks • Establishment of Cattle camps near water points
Long-term measures • Long-range forecasting of rains (2-4 months in advance) • Regional analysis of rainfall patterns • Crop weather watch programs • Value-added Agro-Advisories • Integrated watershed development • Land use diversification • Water harvesting • In-situ moisture conservation
Risk Management and Crop Insurance • Government sponsored National Agricultural Insurance Scheme (NAIS) in operation since Rabi 1999-2000. • Farm Income Insurance Scheme (FIIS) implemented on pilot basis in Rabi 2003-04 and Kharif 2004. Discontinued w.e.f. rabi 2004-05. • Insurance linked to crop loan • Varsha Bima Yojana (Rainfall Insurance) being implemented by some insurance companies like ICICI- Lombard, IFFCO-Tokio, AIC on Pilot basis.
Weather-based Insurance • No state is immune to natural calamities • 12 million hectares of land damaged every year by natural calamities • Agricultural Insurance is an important risk management tool • Agricultural Insurance Company of India Ltd. (AIC) formed on January 1, 2006
Weather Index Insurance Constraints: • High spatial and temporal viability in rainfall • Wide variation from village to village • Recording of rainfall at mandal level which is not representative • Mandals or group of mandals are considered as unit • Lack of transparency in recording and exchange of data
Weather Index Insurance - Rainfall • Advantages: • Indemnity based on rainfall not on an individual • Applicable to several crops • Speedy settlement and transparency • Weather indices could be deficit or excessive rainfall • Disadvantage: • Recurring droughts would make it more expensive
Looking Ahead • Scaling up to states most vulnerable to drought namely Rajasthan, Karnataka, AP and Maharashtra • Inclusion of more partners and consortium approach • Consortium partners could be: CRIDA, CAZRI, SAUs • IIT-Bombay • NRSA, CGWB • State Remote Sensing Centers • Proposed source of funding to be: • NIDM