Download
1 / 18
180 likes | 300 Views
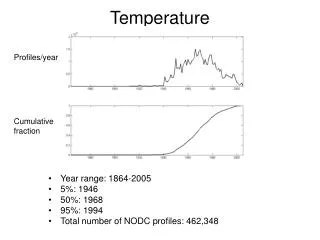
Analysis of Temperature. Basic Calibration Workshop March 10-13, 2009 LMRFC. Historical Data Analysis. Analysis of Temperature Procedure. General Uses only max/min historical temperatures Mean monthly max/min values needed for all stations (ofs and calb) Items Dependant on Type of Area

E N D
Analysis of Temperature Basic Calibration Workshop March 10-13, 2009 LMRFC
Analysis of TemperatureProcedure • General • Uses only max/min historical temperatures • Mean monthly max/min values needed for all stations (ofs and calb) • Items Dependant on Type of Area • Estimation of missing data • Non-mountainous - uses 1/distance • Mountainous - weighs both distance and elevation • Station Weights • Non-Mountainous - based on location • Mountainous - all weight assigned to synthetic station at the mean elevation of the area
Analysis of Temperature • Station Selection • Look for complete records • Look for long periods (ideally 70% of analysis period); no ‘PXPP’ for temp. • Number of stations is less critical than precipitation • Stations inside and outside the basin • 1/d weighting used (1/d2 for precip) • More dependent on altitude, not distance
Analysis of Temperature • Determine: non-mountainous or mountainous area procedure • A mountainous area is one having significant differences in the long term average values of the variable being analyzed over the area. These can be differences in annual or seasonal averages.
Analysis of TemperatureConsistency Checks • Method • Plot sum of deviation of station data from group average versus time • Separate plots for max and min temperatures • Reasons for Inconsistencies • Station moves • Site changes (vegetation, buildings, etc.) • Programs • MAT • No preliminary processing program exists
NWS Double Mass Analysis - TemperatureDefinitions + 0 Deviation of Station Acc. Mean from Group Accumulated Mean ( 0C) - Month/year Ti = station analyzed Tgroup= all stations other than station analyzed m = no. of months
Analysis of TemperatureGuidelines for Consistency Checks • Group Stations by Elevation/Location Climatic shifts can alter the relationship between stations, especially with regard to elevation (stations at similar elevations will all show the same type of shift in their plots --This is real and should not be corrected) • Characteristics of plots • Generally quite straight (temperature not highly variable) • Seasonal wobbles occur when inversions persist during times of the year • Cautions • Mean values change as adjustments are made • MAT Program will compute new Means – must manually update @F, G, and H cards • Extra run required after final adjustments
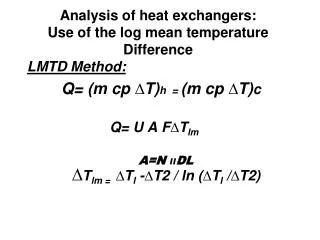
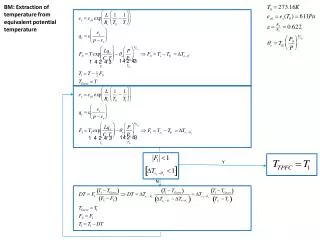
Estimation of Missing DataNon-mountainous and mountainous areas • General equation in MAT program Where: T= max or min temp. T= mean value (max or min) x = station being estimated I = estimator station n = number of station w = weight applied to each estimator d = distance DE = elevation difference Fe = elevation weighting factor; 0 in non-mountainous areas
Analysis of TemperatureStation Weights for MAT Computation • Non-mountainous areas • MAT program uses grid point weighting (similar to precipitation) • Mountainous areas • Predetermined weights: use synthetic station with 100% weight.
Analysis of Temperature in Mountainous Areas • Synthetic station: a station having all missing data located at the mean elevation of the basin or sub-basin. • Lat/lon location is subjective, but should be selected so that the best estimator stations are used.
Mountainous Area AnalysisDetermining Max/Min for Synthetic stations • Based on regional monthly temperature vs. elevation relationship (analogous to isohyetal map for precipitation) • First, make consistency adjustments and determine means for stations with partial records • Can plot data using TAPLOT program • Separate relationship for max and min (lapse rates differ and both varying seasonally) • Relationship can vary from one part of a region to another (e.g. with latitude or distance from coast)
Mountainous Area AnalysisDetermining Max/Min for Synthetic stations, cont’d • Cautions • Make sure that lapse rates are reasonable • Max lapse rate typically greater than min rate • Typical yearly lapse rate for average temperature is 0.6C/100 m or 3.3F/1000 ft • Make sure seasonal lapse rate variations are reasonable • Max variation typically greater than min • Max lapse rate greatest in summer, least in winter
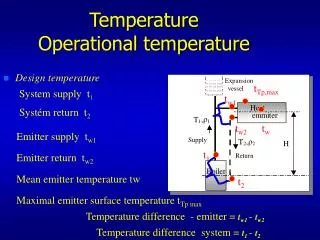
MAT Computational Sequence • Read in data and observation times. Requires initial estimate of mean monthly max and min temperatures for each station. • Applies any consistency corrections to observed data. • Assumes: • Min temp occurs on the day of the observation time • Max temp -If pm observation time, uses that day’s Max Temp -If am observation time, uses Max Temp from previous day 4. Estimates missing max and min temperatures for real or dummy stations. • Uses means input in step 1. • Will apply a monthly max or min to a day if it can’t estimate from other stations. • Looks for closest station in each of 4 quadrants based on HRAP grid:
MAT Computational Sequence Estimation of missing data
MAT Computational Sequence • Applies station weights. • Sum of weights = 1.0 • Applies all weight to a dummy station, if using mtn. area analysis. • Computes weighted max, min temp for each day. • Computes 6 hour mean max/min for each sub-area using a fixed diurnal variation • Writes out 6 hour means to time series. • Generates new monthly mean max and min temperatures from observed data modified by consistency corrections. (@F,@G,@H cards). Note: monthly mean max and min temperatures are always 1 run behind in MAT run sequence.
Limitations of Current MAT • Based solely on max and min temperatures • Assumes time of occurrence of max and min • Max in early afternoon • Min at about 6 am • Uses fixed diurnal variation • Resulting Problems • Diurnal pattern incorrect on some days • Absolute values frequently in error even when diurnal Variation is okay (due to observation time of max/min temperatures)
Limitations of Current MAT, cont’d. • Effects of Using Only Max/Min • Errors in determining the form of precipitation (especially common in the Northeast) • Errors in snowmelt magnitude and timing • Solution • Use instantaneous temperature data in addition to max/min • Technique like currently used in OFS MAT function