Download
1 / 41
410 likes | 509 Views
BreitBurn Energy Partners L.P. NASDAQ: BBEP. Investor Presentation. James G. Jackson | Chief Financial Officer May 2013. Forward Looking Statements. Cautionary Statement Regarding Forward-Looking Information

E N D
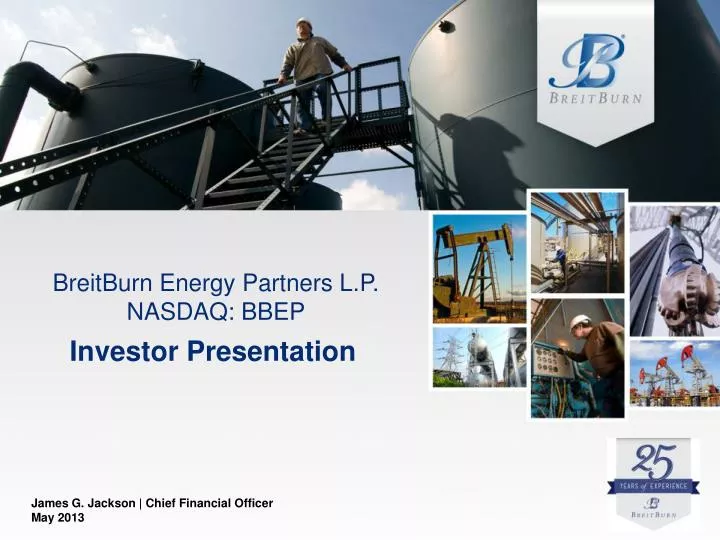
BreitBurn Energy Partners L.P. NASDAQ: BBEP Investor Presentation James G. Jackson | Chief Financial Officer May 2013
Forward Looking Statements Cautionary Statement Regarding Forward-Looking Information This presentation contains forward-looking statements relating to the Partnership’s operations that are based on management's current expectations, estimates and projections about its operations. Words and phrases such as “expected,” “future,” “targeting,” “2013-2017,” “upside,” “guidance,” “potential,” “opportunity” and variations of such words and similar expressions are intended to identify such forward-looking statements. These statements are not guarantees of future performance and are subject to certain risks, uncertainties and other factors, some of which are beyond our control and are difficult to predict. These include risks relating to the Partnership’s financial performance and results, availability of sufficient cash flow and other sources of liquidity to execute our business plan, prices and demand for natural gas and oil, increases in operating costs, uncertainties inherent in estimating our reserves and production, our ability to replace reserves and efficiently develop our current reserves, political and regulatory developments relating to taxes, derivatives and our oil and gas operations, risks relating to our acquisitions, and the factors set forth under the heading “Risk Factors” incorporated by reference from our Annual Report on Form 10-K filed with the Securities and Exchange Commission, and if applicable, our Quarterly Reports on Form 10-Q and our Current Reports on Form 8-K. Therefore, actual outcomes and results may differ materially from what is expressed or forecasted in such forward-looking statements. The reader should not place undue reliance on these forward-looking statements, which speak only as of the date of this press release. Unless legally required, the Partnership undertakes no obligation to update publicly any forward-looking statements, whether as a result of new information, future events or otherwise. Unpredictable or unknown factors not discussed herein also could have material adverse effects on forward-looking statements.
BBEP: Key Investment Considerations • Predecessor founded in 1988, 2006 IPO • Focused on acquisition, exploitation and development of oil and gas properties • Enterprise value: ~$2.7 billion E&P MLP 25 years of Successful Operatorship • Balanced portfolio of oil / gas reserves and production • Long-lived oil and gas properties with 17+ year reserve life • ~149.4 MMBoeest. proved reserves | 80% PDP | 49% oil / 4% NGLs / 47% gas High Quality MLP Assets • Successfully closed 9 acquisitions since July 2011 totaling ~$950 million • 2012 acquisitions totaled > $600 million • Targeting at least $500 million in acquisitions for 2013 Disciplined Acquisition & Exploitation-Oriented Growth • Increased distributions for 12 consecutive quarters • Distributions increased ~27% since Q1 2010 • Best in class distribution growth among E&P MLPs Committed to Distribution Growth • Maintain solid liquidity profile and low leverage ratios • 31% Debt / Enterprise Value (1) ; ~2.4x leverage ratio versus peer average of ~3.6x (2) • ~$100 million drawn on $900 million credit facility (3) Conservative Capital Structure and Financial Flexibility Based on debt as of March 31, 2013 and unit price as of May 8, 2013. Represents 2013 estimated total debt to LTM adjusted EBITDA based on Wells Fargo High Yield Research, May 10, 2013. Average includes EVEP, LGCY, LINE, MEMP, VNR, and QRE. As of May 3, 2013.
Geographically Diversified Asset Base Significant Operations Diversified Among Seven States BreitBurn 2012 Totals(1) • Total Production: 8,318 Mboe (26,426 Boe/d) • Est. Proved Reserves: 149.4 MMBoe • Reserve Mix: 49% Oil / 4% NGLs / 47% Gas • Production Mix: 42% Oil / 2% NGLs / 56% Gas • % Proved Developed: 80% • R/P: ~17 years Michigan 2012 Avg. Daily Prod.: 9,206 Boepd Est. Proved Reserves: 51.7 MMBoe % Proved Developed: 92% R/P: ~17 years Wyoming 2012 Avg. Daily Prod: 7,189 Boepd Est. Proved Reserves: 39.4 MMBoe % Proved Developed: 78% R/P: ~17 years California 2012 Avg. Daily Prod.: 4,068 Boepd Est. Proved Reserves: 25.6 MMBoe % Proved Developed: 85% R/P: ~18 years Indiana and Kentucky 2012 Avg. Daily Prod.: 557 Boepd Est. Proved Reserves: 0.6 MMBoe % Proved Developed: 100% R/P: ~3 years Texas 2012 Avg. Daily Prod: 3,482 Boepd Est. Proved Reserves: 21.7 MMBoe % Proved Developed: 41% R/P:~22 years Florida 2012 Avg. Daily Prod.: 1,924 Boepd Est. Proved Reserves: 10.4 MMBoe % Proved Developed: 100% R/P: ~14 years Reserve data based on YE 2012. For properties acquired during 2012, average daily production reflects acquisition date to December 31, 2012.
Proven Business Strategy Since 1988 Acquisition Criteria Operational Expertise Mature properties with large amounts of OOIP Consistent with current asset base Inventory of low-risk development opportunities Commodity diversity Balanced reserve base Shallow decline, long life reserves with low maintenance capital requirements Balanced reserve and production profile between oil and gas Visible growth through low-risk exploitation and development opportunities Reduced cash flow volatility due to consistent, high level of hedging Excellent industry experience and responsible management Strong track record of integrating acquisitions Significant history with BreitBurn assets Utilize fit-for-purpose technologies 5
Successful Operating Plan that Pays Sequential Distribution Growth • 12 consecutive quarters of distribution growth • FY 2012 distribution growth of ~7%(1) Accretive Acquisitions • Acquire assets that complement existing portfolio and are accretive to DCF/unit Distribution Growth Strong Hedging Strategy • Mitigate commodity price volatility, stabilize cash flow • Hedges added systematically and with new acquisitions Accretive Acquisitions Organic Growth Opportunities • Continuously reviewing base business to identify growth opportunities Effective Hedging Strategy Organic Growth Opportunities Strong MLP Base Assets • Exploit base business of long-life, low-decline, mature assets with predictable production profiles Strong MLP Base Assets Based on total FY 2012 distributions of $1.850 over total FY 2011 distributions of $1.725.
Significant GrowthSince IPO • Since 2006 IPO, BBEP: • Expanded operations from 2 states to 7 states; • Grown estimated proved reserves and avg. daily production by almost 400% • Increased gross productive wells from ~640 to over ~5,400 • Delivered FY 2012 Adjusted EBITDA of $295.8 million (~385% growth from $60.8 million in 2006)(2) • Expanded borrowing base from $100 million to $900 million • Added over 300 employees FY 2012 Estimated Proved Reserves by Region(1) 2006 Estimated Proved Reserves by Region 149.4 MMBoe 30.7 MMBoe Estimated proved reserves by region and by commodity based on FY 2012 Reserve Report. Adjusted EBITDA is a non-GAAP financial measure. See the Appendix for a reconciliation.
An Expanding Portfolio of Great MLP Assets • Geographically diverse across 7 states, concentrated in mature basins with operations dating to 1800s • Long-life (17+ years reserve life), low decline assets with predictable production profiles and organic growth opportunities • Over 5,400 gross producing wells • Brent based pricing for CA crude oil production • Total acreage: ~900,000 gross; 500,000 net acres (1) • Includes over 130,000 net acres in the Utica Collingwood (~85% held by production) • Includes over 75,000 net acres in the developing A-1 Carbonate play in Michigan (80% held by production) • Operational control of 84% of total 2012 production • Extensive inventory of proved low-risk infill drilling, recompletion and development opportunities in core operational areas • Portfolio Highlights Growing Inventory of Proved Drilling Projects Increase Production Organically Based on FY 2012 10K.
High Margin, High Growth Reserve Base Liquids % of Estimated Proved Reserves • Focus on expanding oil / liquids opportunities since 2010 • Acquisitions were key drivers of increased oil exposure • 53% of estimated proved reserves are now Oil / NGLs • Long-term option on natural gas • Provides organic growth opportunity • Large portfolio of proved and low risk potential drilling locations • Expanded PUD Component • Increased Focus on Oil 51% Growth PUD % of Estimated Proved Reserves 123% Growth
Sheridan Crook Big Horn Park Campbell Johnson Washakie Weston Teton Hot Springs Converse Fremont Natrona Niobrara Sublette Platte Lincoln Goshen Sweetwater Carbon Albany Laramie Uinta Wyoming Operating Area • 2012 Operational Highlights • Estimated Proved Reserves by Resource Mix (1) • Asset Map • Key Basins: Wind River, Big Horn, Green River, Powder River • Wells first drilled in 1884; long, active production history • Total acreage: 218,109 gross, 114,896 net • Gross producing wells: 964 • Medium gravity crude; Gas is high BTU (~1,150) • High net revenue interest • Low risk infill drilling opportunities • Low lifting costs: ~$12.50/Boe • Significant bolt on acquisition opportunities • Receive discount to WTI for oil • Receive discount to Henry Hub for gas • Asset Overview • Estimated proved reserves: 39.4 MMboe • Production: 2,542 Mboe (44% oil) • 2012 Capital Program • $32 million (90% spent on oil wells) • Drilled 20 productive development wells, 20 workovers, 6 recompletions • Incremental net production added: ~950 Boe/d • Completed bolt on acquisition of oil properties in the Big Horn Basin in central Wyoming from NiMin Energy Corp (June 2012) Estimated proved reserves and production based on YE 2012 Reserve Report at SEC Prices.
Texas Operating Area • Estimated Proved Reserves by Resource Mix (1) • Asset Overview • 2012 Operational Highlights • Asset Map • Key Basin: Permian • Operating Partner: CrownQuest (66% operatorship currently; 22% operatorship starting May 2013) • Total acreage: 11,880 gross, 8,791 net • Gross producing wells: 90; Avg. Working Interest: 70% • 40 API oil • Large inventory of proved undeveloped drilling locations and 20 acre downspacing opportunities • Low lifting costs: ~$6.20/Boe • Receive slight discount to WTI for oil • Receive premium to Henry Hub for high BTU gas (~1,100) • Estimated proved reserves: 21.7 MMboe • Production: 315 Mboe (57% oil) • Gas production is associated gas only • 2012 Capital Program • $16 million (100% spent on oil wells) • Drilled 18 productive wells • Incremental net production added: ~1,200 Boe/d • Completed five separate acquisitions from CrownRock and Element Petroleum (July) and CrownRock, Lynden Energy, and Piedra Energy (December) BreitBurn Knott Area Cochran Hockley Lubbock Crosby Dickens Yoakum Terry Lynn Garza Kent BreitBurn Zebulon Area Dawson Gaines Borden Scurry Fisher Howard Nolan Andrews Martin Mitchell Coke Ector Midland Sterling Loving Winkler Glasscock Crane Ward Upton Reagan Tom Green Irion Schleicher Crockett Sutton Estimated proved reserves and production based on YE 2012 Reserve Report at SEC Prices.
CaliforniaOperating Area • 2012 Operational Highlights • Key Fields: Santa Fe Springs, Belridge, East Coyote, Sawtelle • Concentrated in large, complex oil fields within the Los Angeles and San Joaquin Basins • Certain fields producing over 100 years • Total acreage: 3,958 gross, 3,128 net • Gross producing wells: 424 • Medium gravity crude • High net revenue interests • Mature fields with low risk development opportunities and significant original oil in place • Low decline rate and maintenance capex • Receive Brent based pricing, traded at a premium to WTI • Estimated Proved Reserves by Resource Mix (1) • Asset Map • Asset Overview • Estimated proved reserves: 25.6 MMboe • Production: 1,183 Mboe (99% oil) • Gas production is associated gas only • 2012 Capital Program • $47 million (100% spent on oil wells) • Drilled 20 productive wells, completed 14 workovers, 1 recompletion • Incremental net production added: ~1,400 Boe/d • Acquisition of 320 acre Dow-Chanslor lease in Belridge oilfield from American Energy Operations (November) East Coyote Brea Olinda Belridge Sawtelle Rosecrans Santa Fe Springs San Luis Obispo Kern San Bernardino Santa Barbara Ventura Los Angeles Riverside Orange San Diego Imperial Estimated proved reserves and production based on YE 2012 Reserve Report at SEC Prices.
Option Value in Large Resource Plays Utica Collingwood & A-1 Carbonate Utica Collingwood Shale Highlights • BreitBurn’s prospective lease position is over 130,000 net acres (~85% is held by production) • Acreage is primarily in the wet gas window • Primary operators in the Utica include Encana • Test well results from other operators were positive and could represent significant upside for BreitBurn • BreitBurn continues to monitor activity in the play and evaluate results as they become publicly available A-1 Carbonate Highlights • The A-1 Carbonate is an extensive, thin bedded, fine grained, organic rich carbonate deposited in a restricted basinal marine setting and is the likely source rock for the Niagaran Reef Trends • BreitBurn’s acreage position in the A-1 Carbonate lies primarily in the Eastern Antrim Trend. Potential prospective areas could exceed 75,000 net acres (80% held by production) • Devon drilled numerous test wells in the region • BreitBurn continues to monitor activity in the play and evaluate results as they become publicly available
2013 Capital Program Summary • 2013 capital budget (excluding acquisitions) totals ~$260 million • 97% of total capital to be spent on high margin oil projects • Drilling / re-drilling 135 wells in 5 states; up to 10 rigs running 2013 • Increase liquids production by over 40% from Q4 2012 to Q4 2013 • Q1 2013 – Completed 16 gross (11.5 net) drill wells, 10 workoversand added 1,110 boe/day in incremental net initial production • Bulk of capital program to be spent in Q2 through Q4 • Production ramp up in second half 2013; December exit rate between 27,770 and 28,850 boe/day Capital Allocation by State ($ in Millions) YE 2013 Wells Drilled / Re-Drilled by State
Disciplined Acquisition Strategy • BreitBurn acquisition strategy unchanged for 25 years • 15 person business development and acquisition evaluation team • Acquire mature oil and gas properties with stable, long-life production and low-risk drilling opportunities • Selective screening adds only high quality assets that complement existing portfolio • 2012 acquisitions exceed acquisition target of $300-$500 million • 2012 acquisitions totaled > $600 million, expanded BBEP presence to 7 states, enhanced exposure to oil, established more balanced portfolio 2012 Transaction Activity Screened ~ 500 opportunities Evaluated 34 assets Bid 20 for ~$1.9 billion Closed 7 Piedra Energy
2012 Acquisition Activity • 2012 acquisitions totaled over $600 million • Increased total estimated proved reserves by ~34 MMBoe • Consisted of principally oil assets with organic growth opportunities Piedra Energy • Note: Table excludes minor bolt-on acquisitions in key operating areas. • Subject to post-closing adjustments. • Estimated proved reserves based on YE 2012 Reserve Report at SEC Prices.
Acquisitions Accretive to DCF • Production growth through acquisitions offset a portfolio of assets with natural decline curves • BBEP target acquisition criteria: • Immediately accretive to distributable cash flow (DCF) • ~5x-6x EBITDA multiple • 2013 acquisition target of at least $500 million A total of $500 million in acquisitions could add ~$23 million to DCF or ~$0.21 per unit
Operating and Financial Performance Strong Operating and Financial Performance Since 2006 IPO Production (Mboe) Adjusted EBITDA ($MM) 30.2%CAGR 31.1%CAGR Strong Operating and Financial Performance Supported by Successful Growth Through Acquisitions Strategy
Disciplined Financial Strategy • Liquidity: Maintain solid liquidity profile • Leverage: Seek to maintain low leverage ratios • Maintain debt to LTM Adjusted EBITDA ratio ≤ 3.0x • Acquisitions financed with ~50% - 60% equity and ~40% - 50% debt • Hedging: Goal of consistently hedging a high percentage of future production • Goal to hedge ~80% of annual production in year 1, ~75% in year 2, ~70% in year 3, ~60% in year 4, and ~50% in year 5 • Aggressively hedge expected production from acquisitions • Stable hedging profile is core element of our business strategy – not a trading tool • Distribution Coverage: Disciplined distribution growth policy considers present and future performance • Targeting Q4 2013 distribution coverage ratio of between 1.1x to 1.2x
Significant Financial Flexibility 2012 – YTD 2013 Debt / Equity Offerings Borrowing Base Redeterminations • Senior Notes • Issued $250 million Senior Notes offering on January 10, 2012 • Issued $200 million add-on offering of Senior Notes on September 24, 2012 • Equity • Issued 9.2 million common units on February 8, 2012 • Issued 11.5 million units on September 6, 2012 • Issued 14.95 million common units on February 7, 2013 • Net proceeds from these transactions were used to fund acquisitions and reduce borrowings under the Partnership’s bank credit facility • Fall 2012 borrowing base redetermination increased borrowing base from $850 million to $1 billion, with total commitments from existing lenders of $900 million • Partnership is currently completing its spring 2013 borrowing base redetermination and is seeking to further expand its financial flexibility with another borrowing base increase • Credit facility matures on May 9, 2016 Existing Senior Notes Since YE 2011, the Partnership has Raised Over $655 Million in Common Equity and $445 Million in Senior Notes
Consistent Distribution Growth for Eleven Straight Quarters • Tax advantaged income (75% shield) 1 • Partnership has made cumulative distributions of $9.80 per unit since IPO • No Incentive Distribution Rights • Future distribution growth supported by: • Ongoing acquisitions • Organic growth • Strong hedge portfolio • Twelve quarters of consecutive distribution increases since Q1 2010 • Distributions • Sequential Quarterly Distribution Growth $1.850 $1.725 $1.560 2013 2012 2010 2011 BreitBurn Continues to Deliver Best in Class Distribution Growth Among E&P MLP Peers • Estimate for common units purchased in February 2013 offering and held through December 2015.
Commodity Price Protection Portfolio: 9ME 12/31/13 – FY 2017 • The chart assumes (i) 9ME 12/31/13 – FY 2017 base business production remains constant at the annualized midpoint of the Partnership's 2013 production guidance (approximately 9.8 million boe) and (ii) oil comprises approximately 53% of total expected production Average Oil and Gas Hedge Prices Note: Includes all current hedges other than 2013 and 2014 call options entered into in October 2011.
Commodity Price Protection – Crude Oil Average Crude Oil Hedge Prices (per bbl) Swaps Puts Collars
Commodity Price Protection – Natural Gas Average Natural Gas Hedge Prices (per mmbtu) Swaps Puts Note: Includes all current hedges other than 2013 and 2014 call options entered into in October 2011.
NYMEX Crude Oil NYMEX Natural Gas Mitigating Commodity Price Volatility • Our hedge portfolio has significantly mitigated crude oil and natural gas price fluctuations as evidenced by our quarterly Adjusted EBITDA 2013 2012 2010 2011 2008 2009 Quarterly Adjusted EBITDA ($MM)
BBEP Value Proposition • BBEP has attractive yield compared to peer group • With current consensus target price of ~$22, BBEP has an implied yield of ~8.6% • BBEP offers attractive opportunity for price appreciation BBEP Target Price Implied Yield – 8.6% Distribution Yield (1) Based on unit prices as of May 8, 2013 and most recently announced quarterly distribution.
Investment Highlights • Responsible Management: • Experienced management team has an average of over 25 years of industry experience • Quality Assets: • High quality asset base with predictable, long-lived production offering • Critical mass in large mature basins with geographic, geologic and commodity diversity • Upside potential in Utica Collingwood Shale and A-1 Carbonate • Consistent Distribution Growth: • Distributions have grown approximately 27% since Q1 2010 • Strong Acquisition Track Record: • Completed 9 acquisitions since July 2011 totaling ~$950 million • Active Hedging: • Substantial hedging through 2017 at $93.67 for oil and $5.02 for gas (1) • Attractive Yield: • ~10.0% yield with an opportunity for price appreciation Weighted average prices per Commodity Price Protection Portfolio as detailed earlier in this presentation.
Appendix1 Financial statements included in the Appendix are from the Q1 2013 10-Q.
2013 Public Guidance ** Footnotes on next slide.
2013 Public Guidance Notes Approximately 30% of oil production is expected to be sold based on Brent pricing. Operating Costs include lease operating costs, processing fees, district expense, and transportation expense. Expected transportation expense totals approximately $6.7 million in 2013, largely attributable to our Florida production. Excluding transportation expense, our estimated operating costs range per Boe is approximately $17.58 - $19.58. Operating Costs are based on flat price levels for 2013 of $95 per barrel for WTI crude oil, $105 per barrel for Brent crude oil and $3.50 per Mcfe for natural gas. Operating costs generally move with commodity prices but do not typically increase or decrease as rapidly as commodity prices. The Partnership typically borrows on a 1-month LIBOR basis, plus an applicable spread. Estimated cash interest expense assumes a 1-month LIBOR rate of 0.3%. Assuming the high and low range of our guidance, Adjusted EBITDA, a non-GAAP financial measure, is expected to range between $330 million and $340 million, and is comprised of estimated net income (before non-cash compensation) between $77 million and $65 million, plus unrealized loss on commodity derivative instruments of $27 million, plus DD&A of $167 million, plus interest expense between $69 million (high end of Adjusted EBITDA) and $71 million (low end of Adjusted EBITDA). Estimated 2013 net income is based on oil prices of $95 per barrel for WTI crude oil, $105 per barrel for Brent crude oil and $3.50 per Mcfe for natural gas. Consequently, differences between actual and forecast prices could result in changes to unrealized gains or losses on commodity derivative instruments, DD&A, including potential impairments of long-lived assets, and ultimately, net income. Total oil and gas capital expenditures for 2013 excludes acquisitions, capitalized engineering costs and information technology spending. Maintenance capital is defined as the estimated amount of investment in capital projects and obligatory spending on existing facilities and operations needed to hold production approximately constant for the period.
Historical Financial StatementsAdjusted EBITDA Note: Footnotes on following slide. The tables present a non-GAAP financial measure, "Adjusted EBITDA," which we use in our business. This measure is not calculated or presented in accordance with generally accepted accounting principles ("GAAP"). We reconcile this measure to the most directly comparable financial measures calculated and presented in accordance with GAAP. We believe the presentation of Adjusted EBITDA provides useful information to investors to evaluate the operations of our business excluding certain items and for the reasons set forth below. Adjusted EBITDA should not be considered an alternative to net income, operating income, cash flow from operating activities or any other measure of financial performance presented in accordance with GAAP. Our Adjusted EBITDA may not be comparable to similarly titled measures of another company because all companies may not calculate Adjusted EBITDA in the same manner. We use Adjusted EBITDA to assess: the financial performance of our assets without regard to financing methods, capital structure or historical cost basis; our operating performance and return on capital as compared to those of other companies in our industry, without regard to financing or capital structure; the viability of acquisitions and capital expenditure projects and the overall rates of return on alternative investment opportunities; and the ability of our assets to generate cash sufficient to pay interest costs and support our indebtedness.
Historical Financial StatementsConsolidated Statement of Operations
Historical Financial StatementsConsolidated Statement of Cash Flows
Florida Operating Area • Estimated proved reserves: 10.4 MMboe • Production: 704 Mboe (100% oil) • 2012 Capital Program • $46 million (100% spent on oil wells) • Drilled 4 productive wells • Incremental net production added: ~600 Boe/d • Incremental reserves added: 2,232 Mboe • Asset Overview • Key fields: Raccoon Point, Bear Island, West Felda, Lehigh • Production is from the Cretaceous Sunniland Trend of South Florida • Operate 5 fields (100% oil) • Total acreage: 37,568 gross, 36,422 net • Gross producing wells: 23 • 24 API oil • High net revenue interests • Receive premium to WTI • Production transported via barge • Estimated Proved Reserves by Resource Mix (1) • Asset Map • 2012 Operational Highlights Lehigh Acres Martin Sunoco Felda Charlotte Glades Lee Hendry West Felda Palm Beach Sunniland Raccoon Point Broward Collier Bear Island Miami-Dade Monroe Estimated proved reserves and production based on YE 2012 Reserve Report at SEC Prices.
Michigan Operating Area • Estimated proved reserves: 51.7 MMboe • Production: 3,370 Mboe (86% gas) • 2012 Capital Program • $12 million (95% spent on oil wells) • Drilled 11 productive wells, 26 recompletions and 5 workovers • Incremental net production added: ~3,600 Mcfe/d • Asset Overview • Estimated Proved Reserves by Resource Mix (1) • Asset Map • 2012 Operational Highlights • Key fields: Antrim Shale; Prairie du Chien, Richfield, Detroit River Zone III, and Niagaran Pinnacle Reefs • BBEP is the largest gas producer in MI; one of the top producers in Antrim Shale • Total acreage: 506,555 gross, 258,398 net • Includes integrated midstream assets • Interests in 3,677 gross productive wells • Additional opportunities for bolt on acquisitions • Receive MichCon City-Gate prices which trade at a premium to Henry Hub • Potential in the A-1 Carbonate and Utica/Collingwood Shales Michigan Antrim Shale Emmet Charlevoix Cheboygan Presque Isle Charlevoix Otsego Alpena Montmorency Leelanau Antrim Oscoda Kalkaska Grand Traverse Alcona Benzie Crawford Estimated proved reserves and production based on YE 2012 Reserve Report at SEC Prices.
BreitBurn Energy Partners L.P. NASDAQ: BBEP Investor Presentation James G. Jackson | Chief Financial Officer May 2013