Download
1 / 1
10 likes | 142 Views
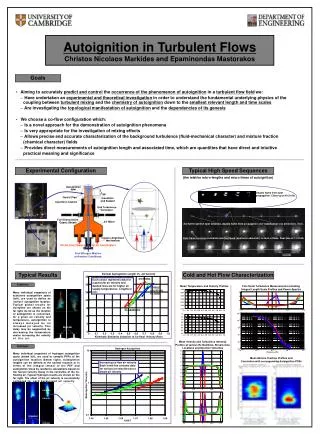
35. Effect of increasing co-flow air velocity : Each trend-line colour group represents data for a particular air velocity. Dashed lines are for higher air inlet temperatures. ‘NOTHING’ Regime. 30. Effect of increasing co-flow air velocity :

E N D
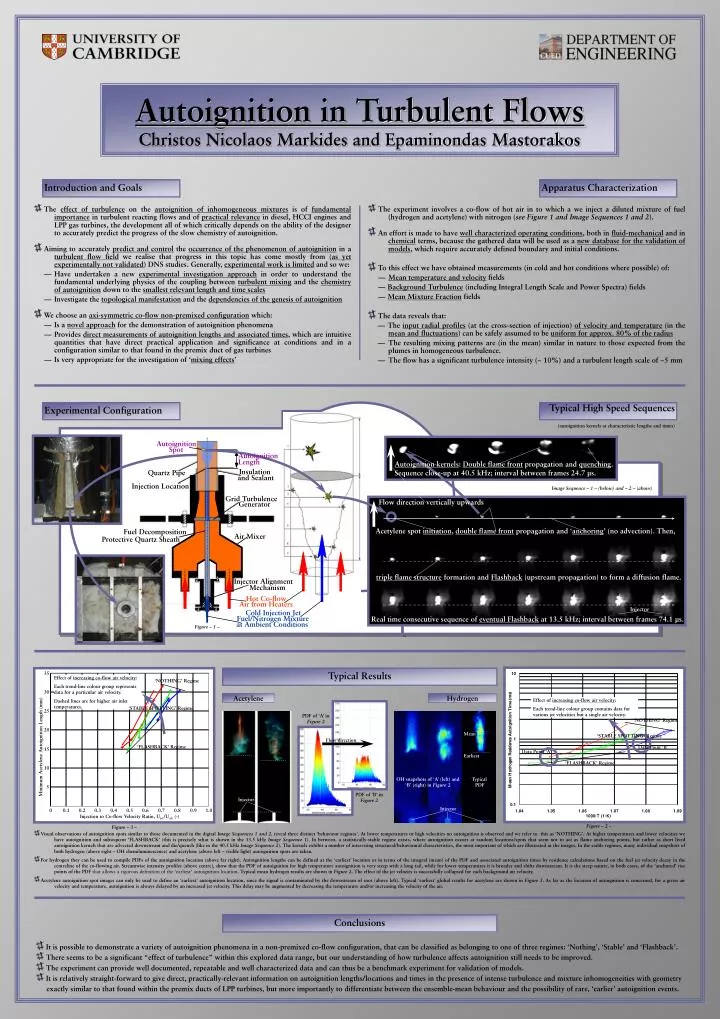
35 Effect of increasing co-flow air velocity: Each trend-line colour group represents data for a particular air velocity. Dashed lines are for higher air inlet temperatures. ‘NOTHING’ Regime 30 Effect of increasing co-flow air velocity: Each trend-line colour group contains data for various jet velocities but a single air velocity. ‘STABLE SPOTTING’ Regime 25 ‘NOTHING’ Regime ‘STABLE SPOTTING’ Regime 20 Data Point ‘B’ Data Point ‘A’ ‘FLASHBACK’ Regime Minimum Acetylene Autoignition Length (mm) 15 ‘FLASHBACK’ Regime 10 5 0.8 0.9 1.0 0 0.1 0.2 0.3 0.4 0.5 0.6 0.7 Injection to Co-flow Velocity Ratio, Ujet/Uair (-) Autoignition in Turbulent FlowsChristos Nicolaos Markides and Epaminondas Mastorakos Introduction and Goals Apparatus Characterization • The effect of turbulence on the autoignition of inhomogeneous mixtures is of fundamental importance in turbulent reacting flows and of practical relevance in diesel, HCCI engines and LPP gas turbines, the development all of which critically depends on the ability of the designer to accurately predict the progress of the slow chemistry of autoignition. • Aiming to accurately predict and control the occurrence of the phenomenon of autoignition in a turbulent flow field we realise that progress in this topic has come mostly from (as yet experimentally not validated) DNS studies. Generally, experimental work is limited and so we: — Have undertaken a new experimental investigation approach in order to understand the fundamental underlying physics of the coupling between turbulent mixing and the chemistry of autoignition down to the smallest relevant length and time scales — Investigate the topological manifestation and the dependencies of the genesis of autoignition • We choose an axi-symmetric co-flow non-premixed configuration which: — Is a novel approach for the demonstration of autoignition phenomena — Provides direct measurements of autoignition lengths and associated times, which are intuitive quantities that have direct practical application and significance at conditions and in a configuration similar to that found in the premix duct of gas turbines — Is very appropriate for the investigation of ‘mixing effects’ • The experiment involves a co-flow of hot air in to which a we inject a diluted mixture of fuel (hydrogen and acetylene) with nitrogen (see Figure 1 and Image Sequences 1 and 2). • An effort is made to have well characterized operating conditions, both in fluid-mechanical and in chemical terms, because the gathered data will be used as a new database for the validation of models, which require accurately defined boundary and initial conditions. • To this effect we have obtained measurements (in cold and hot conditions where possible) of: — Mean temperature and velocity fields — Background Turbulence (including Integral Length Scale and Power Spectra) fields — Mean Mixture Fraction fields • The data reveals that: — The input radial profiles (at the cross-section of injection) of velocity and temperature (in the mean and fluctuations) can be safely assumed to be uniform for approx. 80% of the radius — The resulting mixing patterns are (in the mean) similar in nature to those expected from the plumes in homogeneous turbulence. — The flow has a significant turbulence intensity (~ 10%) and a turbulent length scale of ~5 mm Experimental Configuration Typical High Speed Sequences (autoignition kernels at characteristic lengths and times) Autoignition Spot Autoignition Length Autoignition kernels: Double flame front propagation and quenching. Sequence close-up at 40.5 kHz; interval between frames 24.7 μs. Insulation Quartz Pipe and Sealant Injection Location Image Sequence – 1 – (below) and – 2 – (above) Grid Turbulence Flow direction vertically upwards Generator Acetylene spot initiation, double flame front propagation and ‘anchoring’ (no advection). Then, Fuel Decomposition Air Mixer Protective Quartz Sheath triple flame structure formation and Flashback (upstream propagation) to form a diffusion flame. Injector Alignment Mechanism Hot Co-flow Air from Heaters Injector Cold Injection Jet Fuel/Nitrogen Mixture Real time consecutive sequence of eventual Flashback at 13.5 kHz; interval between frames 74.1 μs. at Ambient Conditions Figure – 1 – Typical Results Acetylene Hydrogen PDF of ‘A’ in Figure 2 Mean Flow direction Earliest OH snapshots of ‘A’ (left) and ‘B’ (right) in Figure 2 Typical PDF PDF of ‘B’ in Figure 2 Injector Injector Figure – 2 – Figure – 3 – • Visual observations of autoignition spots similar to those documented in the digital Image Sequences 1 and 2, reveal three distinct ‘behaviour regimes’. At lower temperatures or high velocities no autoignition is observed and we refer to this as ‘NOTHING’. At higher temperatures and lower velocities we have autoignition and subsequent ‘FLASHBACK’ (this is precisely what is shown in the 13.5 kHz Image Sequence 1). In between, a statistically-stable regime exists, where autoignition occurs at random locations/spots that seem not to act as flame anchoring points, but rather as short lived autoignition kernels that are advected downstream and die/quench (like in the 40.5 kHz Image Sequence 2). The kernels exhibit a number of interesting structural/behavioural characteristics, the most important of which are illustrated in the images. In the stable regimes, many individual snapshots of both hydrogen (above right – OH chemiluminescence) and acetylene (above left – visible light) autoignition spots are taken. • For hydrogen they can be used to compile PDFs of the autoignition location (above far right). Autoignition lengths can be defined at the ‘earliest’ location or in terms of the integral (mean) of the PDF and associated autoignition times by residence calculations based on the fuel jet velocity decay in the centreline of the co-flowing air. Streamwise intensity profiles (above centre), show that the PDF of autoignition for high temperature autoignition is very steep with a long tail, while for lower temperatures it is broader and shifts downstream. It is the steep nature, in both cases, of the ‘anchored’ rise points of the PDF that allows a rigorous definition of the ‘earliest’ autoignition location. Typical mean hydrogen results are shown in Figure 2. The effect of the jet velocity is successfully collapsed for each background air velocity. • Acetylene autoignition spot images can only be used to define an ‘earliest’ autoignition location, since the signal is contaminated by the downstream of soot (above left). Typical ‘earliest’ global results for acetylene are shown in Figure 3. As far as the location of autoignition is concerned, for a given air velocity and temperature, autoignition is always delayed by an increased jet velocity. This delay may be augmented by decreasing the temperature and/or increasing the velocity of the air. Conclusions • It is possible to demonstrate a variety of autoignition phenomena in a non-premixed co-flow configuration, that can be classified as belonging to one of three regimes: ‘Nothing’, ‘Stable’ and ‘Flashback’. • There seems to be a significant “effect of turbulence” within this explored data range, but our understanding of how turbulence affects autoignition still needs to be improved. • The experiment can provide well documented, repeatable and well characterized data and can thus be a benchmark experiment for validation of models. • It is relatively straight-forward to give direct, practically-relevant information on autoignition lengths/locations and times in the presence of intense turbulence and mixture inhomogeneities with geometry • exactly similar to that found within the premix ducts of LPP turbines, but more importantly to differentiate between the ensemble-mean behaviour and the possibility of rare, ‘earlier’ autoignition events.