Download
1 / 20
200 likes | 380 Views
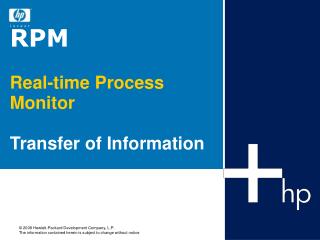
HP NonStop – R P M Real-time Process Monitor Product Overview. HP NonStop Enterprise Division m.miller@hp.com. RPM Overview – What is RPM?. R P M - R eal-time P rocess M onitor New Low-cost Point-product from HP NonStop

E N D
HP NonStop – R P MReal-time Process Monitor Product Overview HP NonStop Enterprise Division m.miller@hp.com
RPM Overview – What is RPM? • RPM - Real-time Process Monitor • New Low-cost Point-product from HP NonStop • Provides ultra-fast discovery and display of busiest Cpus and Processes • By Cpu • By Node • By selected sets of Nodes • Across entire cluster of NonStop nodes
RPM Benefits • Ultra-fast discovery of Cpu and Process busy activity by Cpu, Node, or Clusters of nodes • Continuously finds & shows busiest Cpus & Processes • Simple, fast startup and display in less than 1 second with low overhead, eg TACL 1 > RPM • RPM provides user defined color-encoded busy alerts • Critical - Red • Warning – Yellow • Informative – Blue
RPM Applicability • RPM was developed, evolved, and refined over multi-year period in HP Labs • Applicable regardless of what products or applications currently used • Runs on multiple nodes, multiple operating-systems, and multiple device-types • Supports • J-, H-, G-, D-series - Operating Systems • Runs in mixed-version, multi-node, mixed-hardware networks • Monitors many Cpus and/or Nodes at once • Built based on long-term development requirement to understand real-time dynamics of software operating in large clusters of disparate NonStop servers • Provides fast, real-time, super-cluster monitoring capabilities • Customizable • RPM can support small, medium, and super-scalar display types: • From small 80x24 x16-Cpu displays • To medium 132x54 x64-Cpu displays • To giant 200x300 x1024-Cpu displays • Device Types supported • TTY, T6530, VT100, ANSI • Disk file output • Process file output
RPM General Features • Understands both NSK and OSS file/path names • Install Wizard provides fast setup and configuration eliminates startup learning curve • Supports many different device types including: ANSI, VT100, T6530, TTY, Disk, and Process • Understands T6530 devices for support of legacy displays including 24x80 and 54x132 displays • Understands ANSI/VT100 Super-Sized200x300 character displays which are native (and free) on all Windows and Linux boxes • Supports generic TTY, Disk, Process I/O allowing smart client front-ends and historical stats archival
RPM Analysis Features • Real-time - analysis-and-display of Cpu and Process busy activity by Cpu, node, selected nodes, or entire cluster. • ByCpu– displays busiest processes in one or more Cpus • ByNode - displays busiest processes in one or more nodes • ADD node - commands allow multiple node analysis-display • Results– are sorted, filtered, and color-encoded in real-time • Statistics- synchronized across Cpus, nodes, and users (does NOT require Measure) • Command line – configurable, 1 second response, example: • TACL 1 > RPM P\*, Rate 5, Entries 10, ByNode • Extensive options provide wide-range of analysis-display capabilities • Examples follow...
TACL 1 > RPM PB 3, ENTRIES 10, RATE 5 Process Cpu,Pin Busy% Name RPM Programs ET= 5.0 Top Pri User -------- ------- ----- -------- -------------------------- --- --- ------- \A 3,73 87.82 $STEP $DATA.DATABASE.QUERY 1 1 66,1 11:32:10 3,320 10.13 $QAZ08 $DATA.DATABASE.QADRV1T 2 168 255,34 3,263 1.20 $HIT $SYSTEM.SYS03.TSYSDP2 3 220 255,255 3,319 .15 $QAZ07 $RPM.RPMQA.QADRV1T 4 168 255,34 3,314 .12 $QAZ06 $RPM.RPMQA.QADRV1T 5 168 255,34 3,175 .09 $ZOOH3 $DATA2.R0403V02.ASAPXMON 6 189 255,255 3,0 .06 $MON $SYSTEM.SYS03.OSIMAGE 7 201 255,255 3,192 .04 $X11W $SYSTEM.SYSTEM.RPMVT 8 168 66,1 3,43 .02 $ZOOM3 $SYSTEM.SYSTEM.ASAPMON 9 160 255,255 3,312 .02 $QAZ04 $RPM.RPMQA.QADRV1T 10 168 255,34 RPM Example #1 – Monitor all processes in one Cpu • PB 3, ENTRIES 10, RATE 5 • PB 3 – displays busiest processes in Cpu 3 • ENTRIES 10 – displays the 10 busiest processes • RATE 5 – updates every 5 seconds ( can sample down to 1 sec ) • Commands can be abbreviated, commas optional, for example:P3 E10 R5
TACL 1 > RPM PB *, ENTRIES 10, RATE 5, ByNode Process Cpu,Pin Busy% Name RPM Programs ET= 5.0 Top Pri User -------- ------- ----- -------- -------------------------- --- --- ------- \A 3,73 66.24 $STEP $DATA.DATABASE.DRIVER 1 1 66,1 11:59:05 0,41 11.25 $ZEXP $DATA.DATABASE.QUERY 2 170 255,255 1,159 1.82 $Y7Q6 $SYSTEM.SYS03.NSKCOM 3 159 255,255 1,69 1.70 $ZOO $DATA.DATABASE.LISTREC 4 160 255,255 2,271 .58 $HIT $SYSTEM.SYS03.TSYSDP2 5 220 255,255 2,279 .52 $HIT $SYSTEM.SYS03.TSYSDP2 6 220 255,255 2,28 .18 $X90N $SYSTEM.SYSTEM.RPM 7 168 66,1 1,153 .31 $DATA1 $SYSTEM.SYS03.TSYSDP2 8 167 66,1 3,263 .31 $HIT $SYSTEM.SYS03.TSYSDP2 9 220 255,255 0,0 .30 $MON $SYSTEM.SYS03.OSIMAGE 10 201 255,255 RPM Example #2 – All processes in a node ByNode • PB *, ENTRIES 10, RATE 5, ByNode • PB * – displays Process Busy for all Cpus in a node • ENTRIES 10 – displays the 10 busiest processes • RATE 5 – updates every 5 seconds ( can sample down to 1 sec ) • ByNode – displays busiest processes for all Cpus in node & sorts by node
Process Cpu,Pin Busy% Name RPM T0877(15MAY08) ET= 5.0 Top Pri User -------- ------- ----- -------- -------------------------- --- --- ------- \SANFRAN 0,177 71.17 $Y567 $DATA.DATABASE.DRIVER 1 200 255,255 11:30:20 0,1021 14.24 $Y568 $DATA.DATABASE.QUERY 2 201 255,255 0,256 5.12 $T569 $DATA.DATABASE.LISTREC 3 205 255,255 0,257 .10 $TST1 $DATA.DATABASE.QUERY 4 220 255,255 0,15 .08 $NCP $SYSTEM.SYS03.NCPOBJ 5 199 255,255 \SANFRAN 1,182 11.32 $Z121 $DATA1.ANALYSIS.TOOL 1 168 255,255 11:30:20 1,47 5.31 $Y3AL $DATA1.ANALYSIS.QUERY 2 168 66,1 1,14 .23 $NCP $SYSTEM.SYS03.NCPOBJ 3 199 255,255 1,0 .16 $MON $SYSTEM.SYS03.OSIMAGE 4 201 255,255 1,87 .13 $ZOOS $SYSTEM.SYSTEM.RPM 5 160 255,255 \SANFRAN 2,271 1.08 $HIT $SYSTEM.SYS03.TSYSDP2 1 220 255,255 11:30:20 2,178 .31 $Z147 $SYSTEM.SYSTEM.TEDIT 2 160 255,255 2,0 .04 $MON $SYSTEM.SYS03.OSIMAGE 3 201 255,255 2,303 .02 $TT54 $SYSTEM.SAPP.DRV 4 80 255,255 2,275 .01 $TT62 $SYSTEM.SAPP.DRV 5 80 255,255 \SANFRAN 3,324 3.37 $QAZ08 $DATA1.DATABASE.QADRV1T 1 168 255,34 11:30:20 3,263 .28 $HIT $SYSTEM.SYS03.TSYSDP2 2 220 255,255 3,323 .18 $QAZ07 $ASAP.ASAPXQA.QADRV1T 3 168 255,34 3,322 .12 $QAZ06 $ASAP.ASAPXQA.QADRV1T 4 168 255,34 3,0 .08 $MON $SYSTEM.SYS03.OSIMAGE 5 201 255,255 RPM Example #3 – All processes in a node ByCpu • ByCpu • Used for observing load across Cpus • Visual persistence allows viewing of changing load • PB *, Entries 5, Rate 5, ByCpu • PB * – displays Process Busy for all processes in all Cpus in this node • ENTRIES 5 – displays the 5 busiest processes in each Cpu • RATE 5 – updates every 5 seconds – integrate stats over that interval • ByCpu – displays busy processes grouped by Cpu
TACL 1 > RPM PB \*, ENTRIES 5, RATE 5 Realtime Process Monitor (RPM) - T0877V01.00 - (15APR08) +ADD \A +ADD \B +ADD \C Process Cpu,Pin Busy% Name RPM Programs ET= 5.0 Top Pri User -------- ------- ----- -------- -------------------------- --- --- ------- \A 3,35 74.63 $SPI1 $DATA.DATABASE.DRIVER 1 1 66,1 12:07:05 1,134 51.82 $ZYOB $DATA.DATABASE.QUERY 2 160 255,255 1,175 19.19 $ZERX $DATA.DATBASE.LISTREC 3 167 66,1 1,42 .18 $Z23V $SYSTEM.SYSTEM.DRIVE 4 166 66,1 1,249 .17 $Z244 $SYSTEM.SYSTEM.TEST 5 166 66,1 \B 2,271 4.83 $HIT $SYSTEM.SYS03.TSYSDP2 1 220 255,255 12:07:05 1,254 2.44 $Z08N $SYSTEM.SYSTEM.TEST 2 167 66,1 1,153 .43 $X11Z $SYSTEM.SYSTEM.DRIVE 3 167 66,1 1,74 .18 $RPMX $SYSTEM.SYSTEM.SEEVIEW 4 168 66,1 3,320 .28 $QAZ08 $ASAP.ASAPXQA.QADRV1T 5 168 255,34 \C 0,290 3.76 $SQL $SYSTEM.SYS00.TSYSDP2 1 220 255,255 12:07:05 1,195 2.48 $ZOOL $SYSTEM.SYSTEM.ASAPFIL 2 160 255,255 1,0 1.82 $MON $SYSTEM.SYS00.OSIMAGE 3 201 255,255 0,0 .55 $MON $SYSTEM.SYS00.OSIMAGE 4 201 255,255 0,85 .07 $RPMX $SYSTEM.SYSTEM.SEEVIEW 5 168 66,1 RPM Example #4 – All processes on all nodes • ADD \Node – Adds as many \nodes as you want in RPM analysis and display • PB \*, Entries 5, Rate 5 • PB \* – \* indicates analysis and display is for all ADD-edNodes • ENTRIES 5 – displays the 5 busiest processes in each Node • RATE 5 – updates every 5 seconds – RPM can sample down to 1 second
RPM Example #5 – Composite Cpu + Process reports TACL 1 > RPM ZOOM \*, ENTRIES 5, RATE 5 Realtime Process Monitor (RPM) - T0877V01.00 - (15APR08) +ADD \A +ADD \B +ADD \C Cpus Cp hh:mm ss Busy Secs QLen Disp Disk Chit Swap MLock% Pcb PcbX -------- -- -------- ---- ---- ---- ----- ----- ----- ---- ------ --- ---- \A 0 11:30:45 78 5 0 406 0 4 0 8.00 81 107 1 11:30:45 15 5 0 346 0 0 0 4.29 84 106 2 11:30:45 0 5 0 176 0 40 0 6.73 28 59 3 11:30:45 0 5 0 28 0 0 1 3.54 30 66 \B 0 11:30:45 9 5 0 145 0 15 4 12.51 37 96 1 11:30:45 0 5 0 114 0 0 0 12.32 48 92 2 11:30:45 0 5 0 85 0 0 0 8.32 18 41 3 11:30:45 0 5 0 84 0 0 0 8.33 21 39 \C 0 11:30:45 4 5 0 131 0 4 0 8.01 33 97 1 11:30:45 0 5 0 29 0 0 1 7.65 50 84 Process Cpu,Pin Busy% Name RPM Programs ET= 5.0 Top Pri User -------- ------- ----- -------- -------------------------- --- --- ------- \A 0,35 74.63 $SPI1 $DATA.DATABASE.DRIVER 1 1 66,1 11:30:45 1,134 11.82 $ZYOB $DATA.DATABASE.QUERY 2 160 255,255 1,175 .19 $ZERX $DATA.DATBASE.LISTREC 3 167 66,1 1,42 .18 $Z23V $SYSTEM.SYSTEM.DRIVE 4 166 66,1 1,249 .17 $Z244 $SYSTEM.SYSTEM.TEST 5 166 66,1 \B 0,271 4.83 $HIT $SYSTEM.SYS03.TSYSDP2 1 220 255,255 11:30:45 1,254 .34 $Z08N $SYSTEM.SYSTEM.TEST 2 167 66,1 1,153 .13 $X11Z $SYSTEM.SYSTEM.DRIVE 3 167 66,1 1,74 .08 $RPMX $SYSTEM.SYSTEM.SEEVIEW 4 168 66,1 3,320 .28 $QAZ08 $ASAP.ASAPXQA.QADRV1T 5 168 255,34 \C 0,290 2.79 $SQL $SYSTEM.SYS00.TSYSDP2 1 220 255,255 11:30:45 1,195 .18 $ZOOL $SYSTEM.SYSTEM.ASAPFIL 2 160 255,255 1,0 .62 $MON $SYSTEM.SYS00.OSIMAGE 3 201 255,255 0,0 .15 $MON $SYSTEM.SYS00.OSIMAGE 4 201 255,255 0,85 .07 $RPMX $SYSTEM.SYSTEM.SEEVIEW 5 168 66,1 • ZOOM \* – Displays both Cpu and Process stats in same display
RPM Sample - RATE discussion • RPM - Easily and efficiently supports update rates down to 1 second • Fast 1 Second rate possible due to low-overhead linear-scalable design • Default is 10 seconds because rapid time varying data difficult for some people to follow • When RPM RATE is 10 seconds the digits to right of %Busy decimal point %0.NN represent Cpu milliseconds used. No other RATE provides this numerical convenience: • Milliseconds SET RATE Percent Cpu Busy • 100ms 10 seconds 1.00% Cpu Busy • 90ms 10 seconds 0.90% Cpu Busy • 80ms 10 seconds 0.80% Cpu Busy • 70ms 10 seconds 0.70% Cpu Busy • 60ms 10 seconds 0.60% Cpu Busy • ... ... ...
RPM Installation – Made easy using RPM Wizard • RPM includes a configuration/install wizard: TACL 1 > RUN RPMWIZ • Wizard interviews user and builds configuration • Enter TYPE of device VT100 | T6530 | TTY ? • Enter RATE interval in seconds 2, 3, 6, [10], .. ? • Enter ENTRIES to display per Cpu or Node [3], 5, 10, ... ? • Enter report Type Process | Cpu | Zoom ? • Enter whether you want to sort by Cpu or [Node] ? • Enter whether you want USEC time displayed Y/[N] ? • Enter %BUSY threshold value [0] ? • Enter INFO Busy% threshold value for INFO [1] ? • Enter WARN Busy% threshold value for WARN [10] ? • Enter CRIT Busy% threshold value for CRIT [50] ? • ADD \sysname ? \A • ADD \sysname ? \B • ADD \sysname ? \C • ADD \sysname ? This slide shows only partial wizard interview,complete example of a Wizard session is at:http://NonstopRPM.com/Example-Wizard.htm
RPM Installation – Use RPM Wizard • At End of Interview, the wizard creates RPMCNF configuration file !====================================================== !== RPM Config created by RPMWIZ - 08/02/22 07:20:08 !====================================================== SET TERM VT100 SET RATE 10 SET ENTRIES 10 SET SORT BYNODE SET USEC OFF SET CRIT 50 SET WARN 10 SET INFO 1 ADD \CENTDIV ADD \SOLAR ADD \WINE !====================================================== SAVE to $DATA.RPMV1.RPMCNF Y/N ? Y $DATA.RPMV1.RPMCNF save started. $DATA.RPMV1.RPMCNF saved. Alert Thresholds
RPM – Interfaces • RPM Supports wide-variety of device types • T6530 • ANSI/VT100 x Super-Sized • TTY • File or Process output
RPM – T6530 Device Interface - Example T6530 – ExampleP \*, ByNode, RATE 10, Entries 7 • RPM supports T6530 Devices and emulators • Example • RPM 6530 video high lights >> • P\*R10 E7Analyzes 3 nodes, shows 7 busiest processes per node • RATE 10 aka R10 means update every 10 seconds
RPM – Super-Size ANSI displays • RPM ANSI/VT100 device support: • ANSI represents important class of display with very significant benefits: • ANSI/VT100 provides ultra-high performance Super-Sized displays. • No need for emulator on Windows or Linux. VT100 is natively supported on all Windows or Linux computers. • ANSI/VT100 natively supported on virtually ANY Windows PC. From Windows just enter TELNET <ip-addr> • Example • C:\> TELNET <IP-address/DNS-name> • Supports 200 line x 300 char displays • Allows viewing busiest processes on 1000s of Cpus or 100s of Nodes in single screen • RPM example to right shows busiest Cpus and Processes across many Cpus/Nodes • How to create Windows TELNET shortcuts for NonStop servers see:http://NonstopRPM.com/Faqs.htm
RPM – TTY mode Interface - Example RPM TTY Mode - ExampleP \* TTY, ByNode, RATE 10, Entries 15, USEC • RPM supports TTY mode allowing output to generic devices, processes, and files • RPM USEC option displays Time-of-Dayin Micro-Seconds • Nodes in TimeSync • Wine in different Zone • 100ms delta is I/O time • RPM supports both NSK and OSSfile and path names
RPM Web Resources • HP NonStop RPM - Technical Portal http://NonstopRPM.com/ • RPM - Examples http://NonstopRPM.com/Examples.htm • RPM FAQS - Frequently Asked Questions http://NonstopRPM.com/Faqs.htm • RPM Documents http://NonstopRPM.com/Document.htm • RPM Downloads http://NonstopRPM.com/Download.htm
http://NonstopRPM.com • HP Technology Forum 2008