Download
1 / 12
120 likes | 338 Views
Graphing Polynomials. Algebra 2. Analysis of Graphs of Polynomials. Domain : the set on input values ( x ) Range : the set of output values ( y ) Represented as an interval. Analysis of Graphs of Polynomials. Increasing : where the graph is increasing when looked at left to right

E N D
Graphing Polynomials Algebra 2
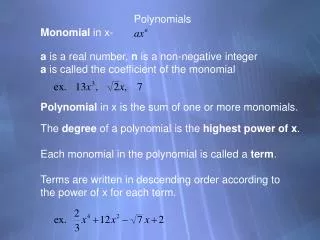
Analysis of Graphs of Polynomials • Domain: the set on input values (x) • Range: the set of output values (y) • Represented as an interval
Analysis of Graphs of Polynomials • Increasing: where the graph is increasing when looked at left to right • Decreasing: where the graph is decreasing when looked at left to right Theincreasing and decreasing values are written as an interval (like domain and range) • BUT! In terms of the domain (x) • Example: Decreasing -∞<x<0 • Increasing 0<x<∞
Analysis of Graphs of Polynomials • Minimum:a point that is where the function changes from decreasing to increasing “low” point on the graph • Maximum: a point that is where the function changes from increasing to decreasing “high” point on the graph
Analysis of Graphs of Polynomials • Minimum & Maximum • Determined by y values! (low/high) • BUT! Written as a point!!! • THERE MAY BE MORE THAN 1! • The “lowest” point on the graph is called the absolute min • The “highest” point on the graph is called the absolute max • Meaning… No other point is lower or higher… hence the name ABSOLUTE!
Analysis of Graphs of Polynomials • Then what is a Minimum & Maximum point called when it is NOT the “lowest” or “highest” point? • If there is a Min / Max that is NOT Absolute… then it is considered a relative min / max • Meaning… there is still a change in direction of the function, but this point is not the “lowest” or “highest” point on the function.
Analysis of Graphs of Polynomials • End Behavior • Starting at the Origin (0,0)… when moving to the left, (negative domain / x values) is the graph Up or Down? • AND moving to the right (positive domain / x values) is the graph UP or Down?
End BehaviorThe degree and sign(positive or negative) of the lead term tells use the end behavior of the graph. If the degree is EVEN then the end behavior of the polynomial is in the same direction. If the degree is ODD then the end behavior of the polynomial is in the opposite direction. odd End Behavior **Think END** Start End positive
Multiplicity • The number of times a given polynomial equation has a root at a given point. • (x+2)2 has a root at -2, but with multiplicity of 2 • Technically two roots at -2 therefore, multiplicity • (x-1)3 has a root at 1, but with multiplicity of 3 • x4 has a root at 0, but with multiplicity of 4
ZerosSolution(s) to the function… where the graph intersects the x-axis. The degree of the polynomial tells us how many zeros there are. They can be real or non-real solutions 3 Zeros!!
MAXIMUM Number of TurnsA polynomial has a maximum number of turnsone less than the value of the degree. Max # of Turns: 2
Sketch of the graph 3 Zeros!! End Behavior **Think END** Start End Max # of Turns: 2