Download
1 / 5
50 likes | 173 Views
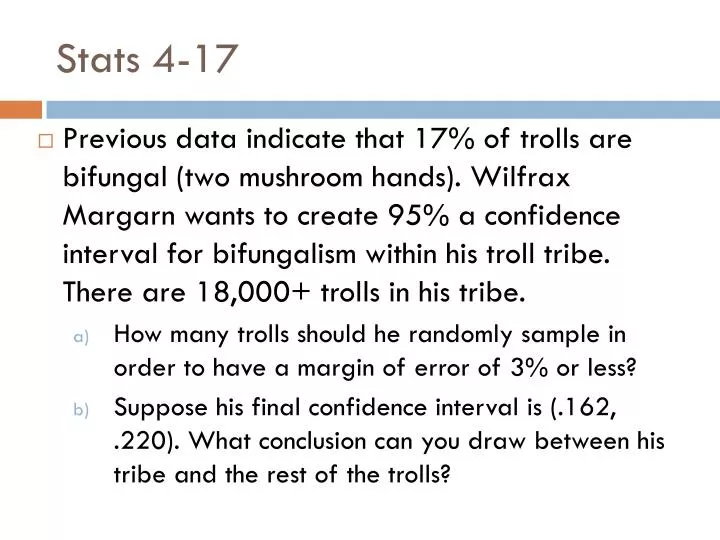
Stats 4-17. Previous data indicate that 17% of trolls are bifungal (two mushroom hands). Wilfrax Margarn wants to create 95% a confidence interval for bifungalism within his troll tribe. There are 18,000+ trolls in his tribe.

E N D
Stats 4-17 • Previous data indicate that 17% of trolls are bifungal (two mushroom hands). WilfraxMargarn wants to create 95% a confidence interval for bifungalism within his troll tribe. There are 18,000+ trolls in his tribe. • How many trolls should he randomly sample in order to have a margin of error of 3% or less? • Suppose his final confidence interval is (.162, .220). What conclusion can you draw between his tribe and the rest of the trolls?
Calculations/Conclusions • Assumed p = .17, find n. • (.162, .220) is the CI. Since it contains .17, we can say that there is insufficient evidence to suggest that Wilfrax’s tribe has lower incidence of bifungalism.
Sample Size calculations for t-test • The margin of error in a t-test confidence interval is t*∙s/√n. If we are interested in capturing a specific margin of error, how should we determine how big of a sample size to use?
Test of the Mean • H0 : μ = μ0 • Ha : μ > μ0; μ < μ0; μ ≠ μ0 • Model: t-test must satisfy randomized, nearly normal and sample < 10% of population. • Mechanics: • Statistics to display: n, s, standard error, t-test stat, x-bar. • Sketch t-distribution for null hypothesis. On the curve, put the test statistic and shade the tail or tails. • Conclusion: • Reject or fail to reject based on P-value • Rewrite conclusion in context of original problem • Express any reservations (data collection, skew)
Group Work • In your groups you will test the data that we collected earlier in the year. The average height for men in America is 5 ft 9½ in. The average height for women is 5 ft 4 in.