Download
1 / 50
500 likes | 598 Views
class 6, 10/11/10 intro to statistical methods. research is research is systematic self-critical inquiry made public (Lawrence Stenhouse, 1981) challenging accepted or “received” knowledge (Alfred North Whitehead) figuring out what the devil people think they are up to (Geertz).

E N D
class 6, 10/11/10 intro to statistical methods
research is • research is systematic self-critical inquiry made public (Lawrence Stenhouse, 1981) • challenging accepted or “received” knowledge (Alfred North Whitehead) • figuring out what the devil people think they are up to (Geertz)
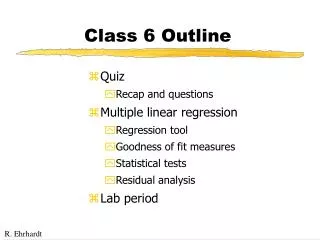
dimensions of research proximity • face-to-face……………………...distanced duration • sampling………….………………..field-based description • measurement…….…………………narrative theory • building…………………...…………..…..testing
model: a graphic explanation of a small part of the world constructing a model • hypothesize the factors involved • hypothesize how they might be related • draw the models • evaluate which one explains the facts best • guesstimate the strengths of paths
drawing a model • label the variables • connect the variables • curved, no arrowheads: correlation • single headed: direction of “effect” • parallel single headed in both directions: mutual effect • describe the strength of the paths • +, -, low, moderate, strong
rules • model must be falsifiable • maximize concreteness • explain as much as possible evaluating models • does this model adequately explain new observations • does this model explain observations better than other models
brief history • statistics:from the same root as state • first use of statistics was descriptive—to describe by counting matters of importance to the State, e.g., census • inferential statistics began with the study of probabilities • once people understood probabilities of an event given certain conditions, they began to realize that they could make inferences from a sample to population
computational shortages and bottlenecks across time (in the West) • paper: mathematicians learned to develop shortcuts, complex algorithms • roman numerals: incredibly clumsy • CXCVIII + XLIV = • no zero • time (pre-calculating machines): development of more shortcuts and algorithms
time (clumsy calculating machines) • computer speed, memory, money (mainframes): algorithms and clever ways to “trick” computers • clumsy software, memory, speed (first PCs) • imagination: with fast computers and unlimited memory, only constraint is how to use them
some people in the history of statistics • Karl Pearson (1857-1936) • Ronald Fisher (1890-1962) • William Gosset (“Student”) (1876-1937) • Prasanta Chandra Mahalanobis (1893-1972) • Andrei Kolmogorov (1903-1987) • John Tukey (1915-2000) • Jerzy Neyman (1894-1981) • Gertrude Cox (1900-1978) • F(lorence) N(ightingale) David (1909-1995)
some moments in history of statistics • 1908: Student’s t-test • 1915: distribution of the correlation coefficient (Fisher) • 1925: Statistical methods for research workers (Fisher) • 1931: Founding of Indian Statistical Institute (Mahalanobis) • 1934: proof of the central limit theorem (Levy, Lindeberg) • 1935: The design of experiments (Fisher)
1945: nonparametric tests (Wilcoxon) • 1947: Mann-Whitney formulation of nonparametric tests • 1959: definitive formulation of hypothesis testing (Lehmann) • 1970: Games, gods, and gambling (F. N. David) • 1977: Cox’s formulation of significance testing • 1977: Exploratory data analysis (Tukey)
Pearson’s 4 parameters • mean • standard deviation • symmetry • kurtosis Parameters are not numbers like measurements. They can never be observed but can be inferred by how the measurements scatter. Parameter comes from the Greek for “almost measurements.” [Salsburg, D. (1981). The lady tasting tea. New York: Henry Holt.]
normal distribution (bell-shaped curved) • many things in the world distributed normally • many statistics distributed normally • in normal distributions only 2 parameters • mathematically, normal distributions, compared to many other distributions, easy to work with
Krathwohl, ch 17: descriptive statistics description by measurement • nominal • 1=freshman, 2=sophomores etc • ordinal • 1=Gretsky; 2=Howe, 3=Hull, 4=Richard etc • interval • fahrenheit scale • ratio • metric scale, eg, distance
graphic representation of data • “to convey the greatest number of ideas in the shortest time with the least ink in the smallest space”
measures of central tendency • mode: measure that appears most often • e.g., survey of favorite restaurants • median: middle score • e.g., baseball players salaries • mean: average • “well behaved data”
skewness: asymmetry in distribution • tail to right: positive skew (mean largest, then median, then mode) • can be due to floor effect • tail to left: negative skew (mean smallest, then median, then mode) • can be due to ceiling effect
measures of dispersion & variability • range: distance from highest to lowest • standard deviation and variance: average distance of each observation from mean (and average distance squared)
standard score (z-score): raw score translated into distance from mean in SD units derived (scale) score: translates standard scores into scale where all scores positive stanine (standard nine): half a SD
in a normal distribution • 68.26% of the cases within 1 SD either side of the mean • 95.44% within 2 SDs • 99.74% within 3SDs
measures of relationships • correlation (Pearson product-moment): strength of relationship, -1 to 1 • positive: as one measure gets larger (or smaller), so does the other • negative: as one measure gets smaller, the other gets larger (or vice versa) • effect of outliers (see figure 17.9) • effect of range (see figure 17.10. 17.11) • effect of nonlinearity (see figures 17.9 & 17.12)
always plot your data look at the plot most carefully
correlation and causation • no statistical relationship necessarily implies causation other correlations for special conditions (beyond the scope of this course) treatment of outliers • be careful and be honest
interpreting statistics • were analyses appropriate • were assumptions underlying analyses met • was sample representative • look carefully at the data and what underlies them exploratory data analysis (Tukey, 1977) • perfectly legitimate, and important, but conclusions or hypotheses that result should be tested with another data set
thinking reaction time speed .7 1.43 .8 1.25 .9 1.11 1.0 1.0 1.1 .91 1.2 .83 1.4 .71 1.5 .67 1.6 .62 • .10 • .05 M: 3.65 .79
Ethics Sieber, ch. 5: Privacy 5.1 • privacy • confidentiality • anonymity 5.2 • the subtlety of privacy issues 5.3 the right to privacy • Hatch Act
5.4 behavioral definition of privacy 5.5 privacy and informed consent 5.6 sensitivity • ask someone who works with population • ask researchers who work with population • ask member of population 5.7 brokered data
APA hints heading levels (62-63) • Centered, Bold, Upper, Lower • Flush Left, Bold, Upper, Lower • Indented, bold, lower paragraph heading ending with period. • Indented, bold, italics, lower paragraph heading ending with period. • Indented, italics, lower paragraph heading ending with period.
Contemporary Realities (1) Cronbach (1975) observed, “It is the special task of the social scientist in each generation to pin down contemporary facts…[and] to realign culture’s view of [people] with present realities” (p. 126). Educational researchers study people interacting in culture. The realities we encounter daily continually change. . . . Other People’s Children(2) The most salient contemporary reality affecting early education and care in contemporary post-industrial societies is that increasingly large segments of these societies have given over the raising of their young children, from an increasingly early age, to others. At one time, only the rich did not raise their own children. Now, the large majority of children are being raised by others. Giving one’s children to others to raise is a new phenomenon for the working and middle classes. Increasing numbers. (3) According to the US Department of Education National Center for Education Statistics, 57% of children age 3-5 in the US are in some kind of institutional early childhood care and education program. For children of mothers with college degrees or higher, the percentage rises to 73%. The percentage of children from 3-5 in at least one “weekly non-parental care arrangements,” which includes, in addition to institutional care, informal out-of-the-home care, for example, with baby sitters or relatives, or children in unlicensed day cares, rises to 73%. Institutional Care. (4) Children in institutional care range . . . .
comma (78-80) • between elements in a series (3 or more)—before and or or (Harvard comma) • the height, width, and depth • to set off nonessential or nonrestrictive clause • John, who loved his wife, was the key informant. • to separate 2 independent clauses joined by a conjunction (e.g., but, and, for, yet etc) • John loved Angela, but Angela loved Rashad.
to set off year in exact dates • April 18, 1992, Masatoshi left…. • April 1992 Masatoshi left…. • to set off year in citations (in parens) • (Hatano, 1998) • in numbers 1,000 or more
Becker ch 3 • [Researchers] have to organize their material, express an argument clearly enough that readers can follow their reasoning and accept the conclusions. They make this job harder than it need be when they think that there is only One Right Way to do it, that each paper has a preordained structure they must find. They simplify their work, on the other hand, when they recognize that there are many effective ways to say something and that their job is only to choose one and execute it so that readers will know what they are doing. (p. 43)
some writing tips • write introductions last (p. 50) • put the conclusion at the beginning (p. 52) • evasive vacuous sentences a good way to begin early drafts • any sentence can be changed, rewritten, or contradicted—you can write anything at all (p. 54) • begin with a “spew” draft (p. 55) • give thoughts a physical embodiment—get them on paper (p. 56)
tips cont. • outlines can help, but not if you begin with them (p. 60) • do what is easiest first (p. 60) • talking about them, instead of just wishing them away, solves all sorts of scientific problems, not just those of writing (p. 64) tips not from Becker • write conclusion first • never start a paper at the beginning • writing not a linear process
more bests • best free music • Krannert Uncorked, most thursdays, 5pm • student and faculty performances, Smith Hall and Krannert (see Inside Illinois) • best place to prepare for Hallowe’en • Dallas & Company, 1st & University, C • best used book stores • Jane Addams, 208 N. Neil C • Old Main Book Shop, 116 N Walnut C • Priceless Books, 108 W Main U
more good reasonably cheap food • pizza: Papa Murphy’s (by Schnuck’s, U, 1753 W. Kirby, C) • Mexican: Dos Reales, 1407 N Prospect, C; 1106 W University, U • American: Courier Café, U
this week free and cheap • under construction
directions to Homer Lake • take Washington in U east. • a few miles east of Urbana, road will end. Turn right, then the first left. • a few more miles road will jog right then left • a few more miles, road will turn into county highway. continue east. • about 15 miles out, you will see wooded area to right, housing development to left. • cross bridge over a channel—bit of lake to right, • continue a few hundred yards to first paved road to right—small sign: Salt Fork Forest Preserve • turn right, continue about ¼ mile—entrance to Homer Lake.
Research In the middle of the ocean, there is a special place, which is a Dragon Gate. It has this wonderful property: Any fish that swims through it immediately turns into a dragon. However, the Dragon Gate does not look any different from any other part of the ocean. So you can never find it by looking for it. The only way to know where it is is to notice that the fish who swim through it become dragons. However, when a fish swims through the Dragon Gate and
becomes a dragon, it doesn’t look any different. It just looks like the same fish it was before. So you can’t tell where the Dragon Gate is by looking closely to find just where the change takes place. Furthermore, when fish swim through the Dragon Gate and become dragons, they don’t feel any different, so they don’t know that they have changed into dragons. They just are dragons from then on.
You could be a dragon! (Howard Becker, 1998, pp. 218-219)