Download
1 / 10
100 likes | 185 Views
CheckImage Collaborative Communications Work Group. Key Messages:

E N D
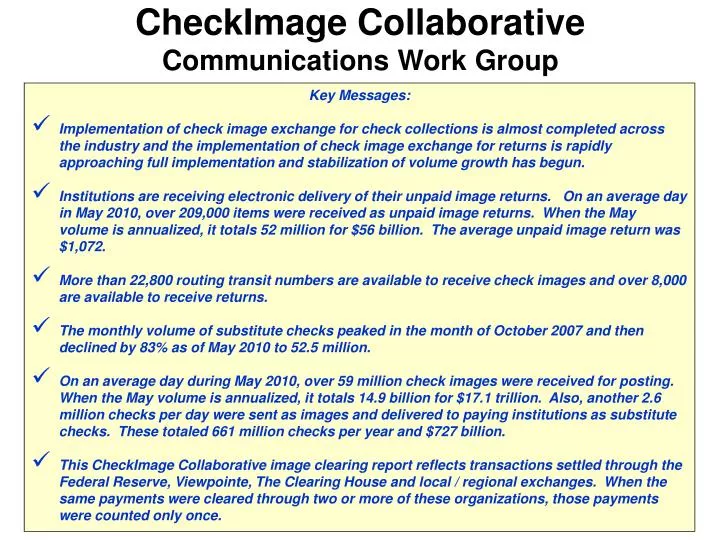
CheckImage Collaborative Communications Work Group • Key Messages: • Implementation of check image exchange for check collections is almost completed across the industry and the implementation of check image exchange for returns is rapidly approaching full implementation and stabilization of volume growth has begun. • Institutions are receiving electronic delivery of their unpaid image returns. On an average day in May 2010, over 209,000 items were received as unpaid image returns. When the May volume is annualized, it totals 52 million for $56 billion. The average unpaid image return was $1,072. • More than 22,800 routing transit numbers are available to receive check images and over 8,000 are available to receive returns. • The monthly volume of substitute checks peaked in the month of October 2007 and then declined by 83% as of May 2010 to 52.5 million. • On an average day during May 2010, over 59 million check images were received for posting. When the May volume is annualized, it totals 14.9 billion for $17.1 trillion. Also, another 2.6 million checks per day were sent as images and delivered to paying institutions as substitute checks. These totaled 661 million checks per year and $727 billion. • This CheckImage Collaborative image clearing report reflects transactions settled through the Federal Reserve, Viewpointe, The Clearing House and local / regional exchanges. When the same payments were cleared through two or more of these organizations, those payments were counted only once.
Highlights: Chart reflects volume received by DFIs for payment from other DFIs or an intermediary. Average daily image volume grew from 40.57 to 59.28 million from June 2008 to May 2010. May 2010 volume annualized is 14.9 billion images received per year. Average # of Images Received /Day # Items in Millions Data Sources: Transactions settled through the Federal Reserve, Viewpointe, The Clearing House and other local / regional exchanges Apr-09 Oct-09 Oct-08 Jun-09 Feb-09 Feb-10 Jun-08 Dec-09 Dec-08 Aug-09 May-10 Aug-08
R/Ts Available Highlights: Chart reflects the number of R/Ts available to receive images from other DFIs or an intermediary. Number of image-available receiving R/Ts grew from 15,324 to 22,854 from June 2008 to May 2010. To Receive Images # of Image-Available R/Ts Data Sources: Transactions settled through the Federal Reserve, Viewpointe, The Clearing House and other local / regional exchanges Apr-09 Oct-09 Oct-08 Jun-09 Feb-09 Feb-10 Jun-08 Dec-09 Dec-08 Aug-09 May-10 Aug-08
Highlights: All checks were imaged before reconversion to substitute checks. Chart reflects checks received by DFIs for payment from other DFIs or an intermediary. The dollar amount received during the first five months of 2008 and 2010 grew from $6.9 to $7.4 trillion. Annualized May 2010 dollar amount = $17.8 trillion/yr. $ Amounts of Images & Substitute Checks Forward Collection Only $ Amounts in Billions Data Sources: Transactions settled through the Federal Reserve, Viewpointe, The Clearing House and other local / regional exchanges Apr-09 Oct-09 Oct-08 Jun-09 Feb-09 Feb-10 Jun-08 Dec-09 Dec-08 Aug-09 May-10 Aug-08
Highlights: All checks were imaged before reconversion to substitute checks. Chart reflects volume received by DFIs for payment from other DFIs or an intermediary. Over 24 month period Image-based clearing volume grew from 1,135 to 1,238 million / mo with 95% of the volume cleared by image in May 2010 (20 days in May). The annualized May ‘10 volume is 15.5 billion items/yr. # of Images & Substitute Checks Forward Collection Only # Items in Millions Images Data Sources: Transactions settled through the Federal Reserve, Viewpointe, The Clearing House and other local / regional exchanges Substitute Checks Apr-09 Oct-09 Oct-08 Jun-09 Feb-09 Feb-10 Jun-08 Dec-09 Dec-08 Aug-09 May-10 Aug-08
Highlights: Chart reflects the number of R/Ts available to receive unpaid image returns from other DFIs or an intermediary. From May 2009 to May 2010, the number of R/Ts available to receive unpaid image returns has more than doubled from 3,511 to 8,023 R/Ts. Number of R/Ts Available to Receive Image Returns # of R/Ts Available to Receive Returns Data Sources: Transactions settled through the Federal Reserve, Viewpointe, The Clearing House and other local / regional exchanges Jun-09 Jul-09 Oct-09 Sep-09 May-09 Jan-10 Mar-10 Feb-10 May-10 Aug-09 Dec-09 Nov-09 Apr-10
Highlights: This chart reports the volume trend of unpaid image returns delivered electronically to the receipt location designated by the bank of first deposit. Between January 2009 and May 2010, the volume of image returns grew by 83% from an average daily volume of 114,000 to 209,300. Average # of Image Returns/Day # Items in Thousands Data Sources: Transactions settled through the Federal Reserve, Viewpointe, The Clearing House and other local / regional exchanges Sep-09 Nov-09 Jul-09 Mar-09 Mar-10 Jan-09 May-10 Jan-10 May-09
Highlights: This chart reports the dollar amount trend of unpaid image returns delivered electronically to the receipt location designated by the bank of first deposit. Between January 2009 and May 2010, the dollar amount of image returns grew by 58% from $2.77 to $4.4 billion. The average dollar amount of image returns ranged from a low of $1,072 per return to a high of $1,215. $ Amount of Returns $ Amounts in Millions Data Sources: Transactions settled through the Federal Reserve, Viewpointe, The Clearing House and other local / regional exchanges Sep-09 Jul-09 Nov-09 May-10 Jan-10 Jan-09 Mar-09 Mar-10 May-09
Highlights: Chart reflects volume received by DFIs for payment from other DFIs or an intermediary. Average daily image volume grew from .08 to 59.82 million from Qtr 1 2005 to Qtr 1 2010. Qtr 1 2010 volume annualized is 14.5 billion images received per year. Average # of Images Received /Day # Items in Millions Data Sources: Transactions settled through the Federal Reserve, Viewpointe, The Clearing House and other local / regional exchanges Qtr 3 '08 Qtr 3 ‘09 Qtr 1 ‘09 Qtr 1 '05 Qtr 3 '07 Qtr 1 '08 Qtr 1 '07 Qtr 1 '06 Qtr 3 '06 Qtr 3 '05 Qtr 1 ‘10
Highlights: Chart reflects check images received by DFIs for payment from other DFIs or an intermediary. The quarterly dollar amount of images received grew from $1.7 billion to $4.1 trillion. Annualized Quarter 1 2010 dollar amount = $16.6 trillion/yr. $ Amounts of Images Received by Paying Institution $ Amounts in Billions Data Sources: Transactions settled through the Federal Reserve, Viewpointe, The Clearing House and other local / regional exchanges Qtr 3 '08 Qtr 3 ‘09 Qtr 1 ‘09 Qtr 1 '05 Qtr 3 '07 Qtr 1 '08 Qtr 1 '07 Qtr 1 '06 Qtr 3 '06 Qtr 3 '05 Qtr 1 ‘10