Download
1 / 9
90 likes | 168 Views
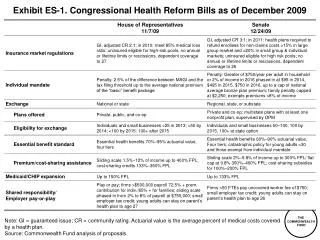
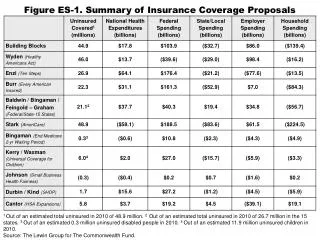
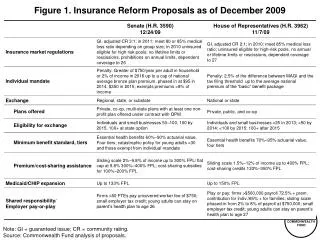
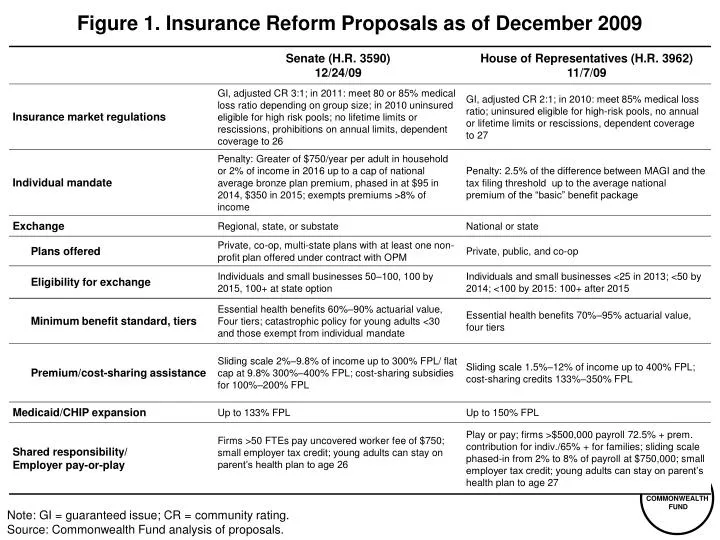
Figure 1 . Insurance Reform Proposals as of December 2009. Note: GI = guaranteed issue; CR = community rating. Source: Commonwealth Fund analysis of proposals. Figure 2 . Trend in the Number of Uninsured Nonelderly, 2012–2019 Under Current Law and Senate and House Bills. Millions.

E N D
Figure 1. Insurance Reform Proposals as of December 2009 Note: GI = guaranteed issue; CR = community rating. Source: Commonwealth Fund analysis of proposals.
Figure 2. Trend in the Number of Uninsured Nonelderly, 2012–2019 Under Current Law and Senate and House Bills Millions Note: The uninsured includes unauthorized immigrants. With unauthorized immigrants excluded from the calculation, nearly 94% and 96% of legal nonelderly residents are projected to have insurance under the Senate and House proposals, respectively. Data: Estimates by The Congressional Budget Office.
Figure 3. System Improvement Provisions of National Health Reform Proposals, 2009 Source: Commonwealth Fund analysis of health reform proposals.
Figure 4. Senate and House Payment and System Reform Savings, 2010–2019 Dollars in billions Source: The Congressional Budget Office Cost Estimate of the Patient Protection and Affordable Care Act, Dec. 19, 2009, http://www.cbo.gov/doc.cfm?index=10868. The Congressional Budget Office Analysis of H.R. 3962, The Affordable Health Care for America Act, Nov. 20, 2009, http://www.cbo.gov/doc.cfm?index=10741.
Figure 5. Major Sources of Savings and Revenues Compared with Projected Spending, Net Cumulative Effect on Federal Deficit, 2010–2019 Dollars in billions Note: Totals do not reflect net impact on deficit because of rounding. Source: The Congressional Budget Office Cost Estimate of the Patient Protection and Affordable Care Act, Dec. 19, 2009, http://www.cbo.gov/doc.cfm?index=10868. The Congressional Budget Office Analysis of H.R. 3962, The Affordable Health Care for America Act, Nov. 20, 2009, http://www.cbo.gov/doc.cfm?index=10741.
Figure 6. Proportions of System Savings and New Revenue in Senate and House Bills Dollars in billions Impact on Deficit: –$138 Impact on deficit: –$132 Cost of coverage expansion: $891 Cost of coverage expansion: $763 Note: Totals do not reflect net impact on deficit because of rounding. Source: The Congressional Budget Office Cost Estimate of the Patient Protection and Affordable Care Act, Dec. 19, 2009, http://www.cbo.gov/doc.cfm?index=10868, and The Joint Committee on Taxation Estimated Revenue Effects of the Revenue Provisions in the “Patient Protection and Affordable Care Act”, December 19, 2009, JCX-61-09. The Congressional Budget Office Analysis of H.R. 3962, The Affordable Health Care for America Act, As Passed by the House of Representatives, November 20, 2009, http://www.cbo.gov/doc.cfm?index=10741.
Figure 7. Sources of New Revenue inSenate and House Bills Other revenues ($93 billion, 13%) Income surtax on wealthy ($461 billion, 63%) Other revenues ($76 billion, 15%) Insurer excise tax ($149 billion, 29%) Industry contribution ($20 billion, 3%) Industry contribution ($101 billion, 19%) Employer play-or-pay ($135 billion, 18%) Medicare payroll tax ($87 billion, 17%) Tax and outlay effects* ($65 billion, 12%) Uninsured payments ($33 billion, 4%) Uninsured payments ($15 billion, 3%) Employer play-or-pay ($28 billion, 5%) House (H.R. 3962) Senate (H.R. 3590) Note: Numbers may not sum to 100% due to rounding. In addition, taxes and outlay effects are excluded from the sources of revenue for H.R. 3962 because taxes and outlay effects are estimated to result in an additional $6 billion in federal spending over the 2010-2019 period. Source: The Congressional Budget Office Cost Estimate of the Patient Protection and Affordable Care Act, Dec. 19, 2009, http://www.cbo.gov/doc.cfm?index=10868, and The Joint Committee on Taxation Estimated Revenue Effects of the Revenue Provisions in the “Patient Protection and Affordable Care Act”, Dec. 19, 2009, JCX-61-09. The Congressional Budget Office Analysis of H.R. 3962, The Affordable Health Care for America Act, As Passed by the House of Representatives, November 20, 2009, http://www.cbo.gov/doc.cfm?index=10741.
Figure 8. Proposals’ Impact on Insurance Coverage and Costs, 2019 Source: The Congressional Budget Office Cost Estimate of the Patient Protection and Affordable Care Act, Dec. 19, 2009, http://cbo.gov/doc.cfm?index=10868. The Congressional Budget Office Analysis of H.R. 3962, The Affordable Health Care for America Act, As Passed by the House of Representatives, November 20, 2009, http://www.cbo.gov/doc.cfm?index=10741.
Figure 9. Major Areas of Similarities and Differences Between Bills Source: Commonwealth Fund analysis of health reform proposals.