Download
1 / 25
260 likes | 268 Views
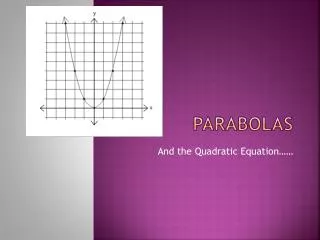
Graphing Parabolas. Using the Vertex Axis of Symmetry & y-Intercept By: Jeffrey Bivin Lake Zurich High School jeff.bivin@lz95.org. Last Updated: October 15, 2007. Graphing Parabolas.

E N D
Graphing Parabolas Using the Vertex Axis of Symmetry & y-Intercept By: Jeffrey Bivin Lake Zurich High School jeff.bivin@lz95.org Last Updated: October 15, 2007
Graphing Parabolas • With your graphing calculator, graph each of the following quadratic equations and identify the vertex and axis of symmetry. y = x2 + 4x - 7 y = 2x2 + 10x + 4 y = -3x2 + 5x + 9 Jeff Bivin -- LZHS
Graph the following parabola x = -2 y = x2 + 4x - 7 vertex: axis of symmetry: (0, -7) (-2, -11) y-intercept: Jeff Bivin -- LZHS
Graph the following parabola y = 2x2 + 10x + 4 vertex: axis of symmetry: y-intercept: Jeff Bivin -- LZHS
Graph the following parabola y = -3x2 + 5x + 9 vertex: axis of symmetry: y-intercept: Jeff Bivin -- LZHS
Graphing Parabolas • Now look at the coefficients of the equation and the value of the axis of symmetry – especially a and b • y = ax2+ bx + c y = x2 + 4x - 7 y = 2x2 + 10x + 4 y = -3x2 + 5x + 9 Jeff Bivin -- LZHS
Graphing Parabolas y = ax2 + bx + c Axis of symmetry: Vertex: Jeff Bivin -- LZHS
Graph the following parabola x = -2 re-visited y = x2 + 4x - 7 axis of symmetry: vertex: (0, -7) (-2, -11) y-intercept: Jeff Bivin -- LZHS
Graph the following parabola re-visited y = 2x2 + 10x + 4 (0, 4) axis of symmetry: vertex: y-intercept: Jeff Bivin -- LZHS
Graph the following parabola Why did this parabola open downward instead of upward as did the previous two? re-visited y = -3x2 + 5x + 9 axis of symmetry: vertex: y-intercept: Jeff Bivin -- LZHS
Graph the following parabola y = x2 + 6x - 8 x = -3 Axis of symmetry: (0, -8) Vertex: (-3, -17) y-intercept: Jeff Bivin -- LZHS
Graph the following parabola y = -2x2 + 7x + 12 (0, 12) Axis of symmetry: Vertex: y-intercept: Jeff Bivin -- LZHS
Graphing Parabolas In Vertex Form Jeff Bivin -- LZHS
Graphing Parabolas • With your graphing calculator, graph each of the following quadratic equations and identify the vertex and axis of symmetry. y = x2 vertex axis of sym. y = (x - 5)2 - 4 y = -3(x + 2)2 + 5 y = ⅜(x - 3)2 + 1 Jeff Bivin -- LZHS
Graph the following parabola x = 5 y = (x - 5)2 - 4 (0, 21) axis of symmetry: vertex: (5, 4) y-intercept: Jeff Bivin -- LZHS
Graph the following parabola (-2, 5) y = -3(x + 2)2 + 5 axis of symmetry: vertex: (0, -7) x = -2 y-intercept: Jeff Bivin -- LZHS
Graph the following parabola x = 3 y = ⅜•(x - 3)2 - 1 axis of symmetry: vertex: y-intercept: (3, -1) Jeff Bivin -- LZHS
Graphing Parabolas In Intercept Form Jeff Bivin -- LZHS
Graph the following parabola x = 1 0 y = (x – 4)(x + 2) x-intercepts: (-2, 0) (4, 0) (0, -8) axis of symmetry: (1, -9) vertex: y-intercept: Jeff Bivin -- LZHS
Graph the following parabola x = 5 0 y = (x - 1)(x - 9) (0, 9) x-intercepts: (1, 0) (9, 0) axis of symmetry: (5, -16) vertex: y-intercept: Jeff Bivin -- LZHS
Graph the following parabola 0 y = -2(x + 1)(x - 5) (2, 18) (0, 10) x-intercepts: (-1, 0) (5, 0) axis of symmetry: x = 2 vertex: y-intercept: Jeff Bivin -- LZHS
Convert to standard form y = -2(x + 1)(x - 5) y = -2(x2 – 5x + 1x – 5) y = -2(x2 – 4x – 5) y = -2x2 + 8x + 10 Jeff Bivin -- LZHS
Now graph from standard form. y = -2x2 + 8x + 10 (2, 18) Axis of symmetry: (0, 10) Vertex: x = 2 y-intercept: Jeff Bivin -- LZHS
A taxi service operates between two airports transporting 200 passengers a day. The charge is $15.00. The owner estimates that 10 passengers will be lost for each $2 increase in the fare. What charge would be most profitable for the service? What is the maximum income? VERTEX Income = Price ● Quantity Define the variable x = number of $2 price increases f(x) = ( 15 + 2x ) ( 200 – 10x ) 15 + 2x = 0 200 – 10x = 0 f(x) = income 2x = -15 200 = 10x Vertex is: So, price = (15 + 2x) = (15 + 2(6.25)) = 15 + 12.5 = $27.50 Maximumincome: 137.50 27.50 Jeff Bivin -- LZHS
Alternative Method A taxi service operates between two airports transporting 200 passengers a day. The charge is $15.00. The owner estimates that 10 passengers will be lost for each $2 increase in the fare. What charge would be most profitable for the service? What is the maximum income? VERTEX Income = Price ● Quantity Define the variable x = number of $2 price increases f(x) = ( 15 + 2x ) ( 200 – 10x ) f(x) = 3000 – 150x + 400x – 20x2 f(x) = income f(x) = – 20x2 + 250x + 3000 f(6.25) = – 20(6.25)2 + 250(6.25) + 3000 f(6.25) = 3781.25 Vertex is: So, price = (15 + 2x) = (15 + 2(6.25)) = 15 + 12.5 = $27.50 Maximum income = f(x) = $3781.25 Jeff Bivin -- LZHS