Download
1 / 14
140 likes | 145 Views
Western Wind Integration Study. Debbie Lew NREL. Goal. To support multi-state interests in understanding the operating and cost impacts due to the variability and uncertainty of wind and solar power on the grid, supporting:

E N D
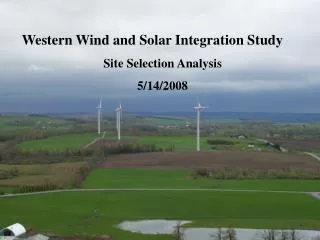
Western Wind Integration Study Debbie Lew NREL
Goal • To support multi-state interests in understanding the operating and cost impacts due to the variability and uncertainty of wind and solar power on the grid, supporting: • Western Governor’s Clean and Diversified Energy Initiative - 30 GW clean energy by 2015 • President’s Advanced Energy Initiative - wind can supply up to 20% of US electricity consumption
Issues to investigate • Mitigation measures to manage the incremental variability and uncertainty of wind and solar • Greater diversity of wind/solar resources to reduce variability and increase transmission utilization • Compare local wind/solar resources to better class out-of-state resources (correlation with load, cost) • How hydro can help with wind/solar integration and whether there are limits to the use of hydro for wind/solar integration • The role and value of wind forecasting • Benefits from Balancing Area cooperation or consolidation to manage the variability • Contribution of wind and solar reliability and capacity value
Key Tasks • Data Collection • Preliminary Analysis • Scenario Development • Run Scenarios • Draft and Final Report
Data Collection • Wind/solar data development • Mesoscale modeling of 10 min wind at 2 km resolution for 3 years (2004-2006) • Request wind data from utilities and developers to validate mesomodeling and wind development information to help determine wind sites • Rank sites by capacity factor, note distance from transmission • 1-min data for selected periods • Load and generation data by utility • Hourly for three years (2004-06) • Samples of sub-hourly load (1-min, 10-min) data by utility • Maneuverability and constraints for existing generating resources (MW/minute ramp rates and minimum operating points) • Historical output for existing wind and solar generation facilities • Transmission load flows by control area operator • Obtain from WECC • Load forecast and load forecast error data • Request from utilities
Preliminary Analysis Analysis, including statistical analysis, to help select wind and transmission inputs for scenario design • Group sites into 10-20 wind regions • Statistical analysis with spatial and temporal slices, looking at wind/load variability and correlation • Production value of wind sites - rank by capacity factor • Transmission capability between wind regions • Based on statistical analysis, production value, and transmission capability, develop preliminary costs for each wind region • Based on this analysis, best guess at high renewables scenario (e.g. 30% wind, 5% solar) that is a good balance of resources, existing & new infrastructure, and operability • Develop scenarios to answer specific questions • Stakeholder Meeting to review preliminary analysis and provide input into scenarios - June 2008
Scenario Description • “Baseline” - 6 control areas have no new renewables • Current levels of renewables in rest of WECC are a ‘best case’ in that there is no extra variability and displacement to account for in the rest of WECC. High levels of renewables in rest of WECC are a ‘worst case’ in that the rest of WECC has to accommodate a high level of variability and displacement before we even consider our 6 control areas. • “High renewables” • We run a high renewables scenario such as 30% wind/5% solar for 2015. If this doesn’t break the system, we move to the variations. If this results in high costs, we change this high renewables case, e.g., by adjusting adjust the non-renewables generation for more flexibility or by reducing the penetration to 20%/3%. • Variations on the “High renewables” case could include • “Diversified” geographic sites • “In-state” renewables • “Mega-projects” with several concentrated project sites • “Best correlated with load” sites • Really need to look at the data to see what makes sense
Run Scenarios • For each scenario • Transmission load flow - run PSLF • Run MAPS for all of WECC for hourly variability and imports/exports • Quasi-QSS analysis for intra-hour variability • Expected results • Operating Impacts • Regulation • Load following • Unit Commitment • Evaluate physical performance and limitations of power grid • Transmission Congestion • Reliability metrics such as CPS, ACE, etc. • Evaluate economic/financial performance • Total cost of variable energy production • Changes in emissions (SOx, NOx, CO2) • Impacts of Variable Renewable Generation on the Operations of Hydro generation
Run Scenarios (cont.) • As necessary, evaluate mitigation measures: • Modification of operating procedures • Generation flexibility (existing and new) • Load maneuverability • Wind controls (including curtailment options) • Balancing area consolidation (physical and virtual) • Reserve and ACE sharing • Regional imbalance markets • Storage • Forecasting • “Dives” can be done to examine specific issues such as Hoover resources • Effective Load Carrying Capability and Loss of Load Probability analysis run for 2-3 scenarios (e.g., “in-state”, “diversified”)
Reporting • Draft results and report will be presented at stakeholder meeting early 2009 • Final report completed by 2Q 2009
Data Collection • Wind/solar data development • Request wind/solar data from utilities and developers to validate mesomodeling and wind/solar development information to help determine sites • Load and generation data by utility • Hourly for three years (2004-06?) • Samples of sub-hourly load (1-min, 10-min) data by utility • Maneuverability and constraints for existing generating resources (MW/minute ramp rates and minimum operating points) • Historical output for existing wind and solar generation facilities • Samples of 1 minute or short timescale output of wind or solar facilities • Transmission load flows by control area operator • Obtain from WECC • Load forecast and load forecast error data • Request from utilities • Regulatory, operational, and contractual constraints • Request from utilities
Western Wind Integration Study Loads Rest of WECC Control areas: APS SRP Tucson Electric PNM NV Power Sierra Pacific Xcel Tri-State/WAPA El Paso