Download
1 / 39
390 likes | 399 Views
Proxima Centauri, the red star at the center, is the closest star to the sun. A star is a large, glowing ball of gas in space, which generates energy through nuclear fusion in its core. The closest star to Earth is the sun, which is considered to be a fairly average star.

E N D
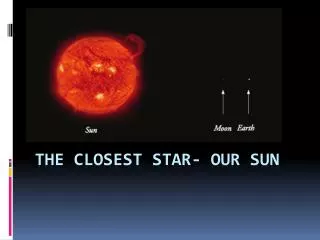
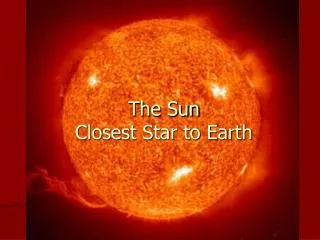
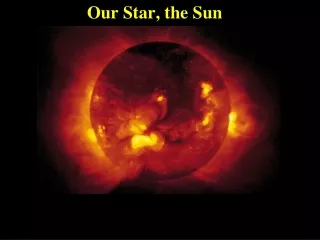
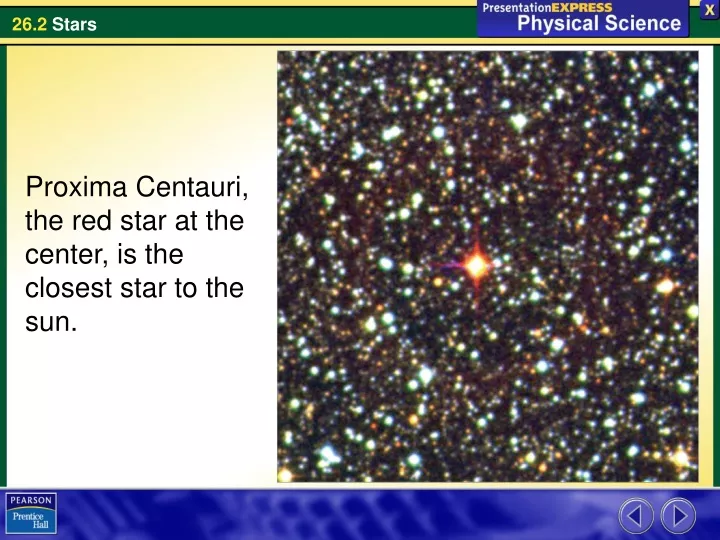
Proxima Centauri, the red star at the center, is the closest star to the sun.
A star is a large, glowing ball of gas in space, which generates energy through nuclear fusion in its core. The closest star to Earth is the sun, which is considered to be a fairly average star.
How can the distance to a star be measured? The apparent change in position of an object with respect to a distant background is called parallax. Astronomers measure the parallax of nearby stars to determine their distance from Earth. Distance to the Stars
Distance to the Stars The Light-Year Because stars are so far apart, it’s not practical to measure their distances in units that might be used on Earth, such as kilometers. • A light-year is the distance that light travels in a vacuum in a year, which is about 9.5 trillion kilometers. • Proxima Centauri, the closest star to the sun, is about 4.3 light-years away.
Distance to the Stars Parallax Stars are so far away that astronomers cannot measure their distances directly. Astronomers are able to observe stars from two different positions–opposite sides of Earth’s orbit. Nearby stars appear to move against the more-distant background stars.
Distance to the Stars You can observe parallax by holding your thumb in front of you and looking at it first with one eye and then with the other.
Distance to the Stars With the invention of the telescope, astronomers could measure the positions of stars with much greater accuracy. • The closer a star is to Earth, the greater is its parallax. • Astronomers have measured the parallax of many nearby stars and determined their distances from Earth.
Distance to the Stars With present technology, the parallax method gives reasonably accurate distance measurements for stars within a few hundred light-years. Astronomers have developed other ways to estimate distances to more-distant stars.
How do astronomers categorize stars? Astronomers classify stars by their color, size, and brightness. Other important properties of stars include their chemical composition and mass. Properties of Stars
What elements are found in stars? Most stars have a chemical makeup that is similar to the sun, with hydrogen and helium together making up 96 to 99.9 percent of the star’s mass. Properties of Stars
Properties of Stars Color and Temperature A star’s color indicates the temperature of its surface. • The hottest stars, with surface temperatures above 30,000 K, appear blue. • The surfaces (photospheres) of relatively cool red stars are still a toasty 3000 K or so. • Stars with surface temperatures between 5000 and 6000 K appear yellow, like the sun.
Properties of Stars Betelgeuse, Procyon, and Sirius are three of the brightest stars in the sky. Betelgeuse is a much cooler star than the others.
Properties of Stars Brightness Astronomers have discovered that the brightness of stars can vary by a factor of more than a billion. Stars that look bright may actually be farther away than stars that appear dim.
Properties of Stars These streetlights all have about the same absolute brightness, but the closer lights appear brighter.
Properties of Stars The sun appears very bright to us because it is much closer than other stars. The brightness of a star as it appears from Earth is called its apparent magnitude. The apparent brightness of a star decreases as its distance from you increases.
Properties of Stars Absolute magnitude is how bright a star really is. A star’s absolute brightness is a characteristic of the star and does not depend on how far it is from Earth. You can calculate a star’s absolute brightness if you know its distance from Earth and its apparent brightness.
Properties of Stars Size and Mass Once astronomers know a star’s temperature and absolute brightness, they can estimate its diameter and then calculate its volume. The masses of many stars can be determined by observing the gravitational interaction of stars that occur in pairs. For most stars, there is a relationship between mass and absolute brightness.
Properties of Stars Composition A spectrograph is an instrument that spreads light from a hot glowing object into a spectrum. Astronomers can use spectrographs to identify the various elements in a star’s atmosphere.
Properties of Stars This is the spectrum of a star. The dark absorption lines indicate the presence of various elements in the star.
Properties of Stars The elements within a star’s atmosphere absorb light from the star’s photosphere. Each element absorbs light of different wavelengths. A star’s bright spectrum has a set of dark lines called absorption lines that show where light has been absorbed.
Properties of Stars Absorption lines can be used to identify different elements in the star. Absorption lines of most elements have been identified in the spectra of stars. Observations of such lines in many stars have shown that the composition of most stars is fairly similar.
How do astronomers use H-R diagrams? H-R diagrams are used to estimate the sizes of stars and their distances, and to infer how stars change over time. The Hertzsprung-Russell Diagram
The Hertzsprung-Russell Diagram Stars can be classified by locating them on a graph showing two easily determined characteristics. Such a graph is called a Hertzsprung-Russell diagram, or H-R diagram. An H-R diagram is a graph of the surface temperature, or color, and absolute brightness of a sample of stars.
The Hertzsprung-Russell Diagram The horizontal axis shows the surface temperatures of stars. A star’s color is directly related to its surface temperature. The hottest blue stars are on the left and the coolest red stars are on the right. Surface temperatures of stars range from less than 3000 K to more than 30,000 K.
The Hertzsprung-Russell Diagram The vertical axis of the H-R diagram shows absolute brightness, with the brightest stars at the top and the faintest at the bottom. The absolute brightnesses of stars vary even more than temperature, ranging from about one ten-thousandth to a million times that of the sun.
The Hertzsprung-Russell Diagram A star’s placement on an H-R diagram indicates its absolute brightness and surface temperature (or color).
The Hertzsprung-Russell Diagram Main-Sequence Stars Stars occur only in certain places on the H-R diagram. Most stars are found along a diagonal band running from the bright hot stars on the upper left to the dim cool stars on the lower right. Astronomers call this diagonal band on the H-R diagram the main sequence. About 90% of all stars are found on the main sequence. The sun lies near the middle of this band.
The Hertzsprung-Russell Diagram Giants and Dwarfs In general, two factors determine a star’s absolute brightness: its size and its surface temperature. An H-R diagram shows a star’s absolute brightness and surface temperature. • If you compare two stars at the same temperature, the brighter one must be larger. • Hotter stars are brighter than cooler stars of the same size.
The Hertzsprung-Russell Diagram The very bright stars at the upper right of the H-R diagram are called supergiants. Supergiants are much brighter than main-sequence stars of the same temperature, so they must be very large compared with main-sequence stars.
The Hertzsprung-Russell Diagram Supergiants range in size from 100 to 1000 times the diameter of the sun. Just below the supergiants on the H-R diagram are the giants—large, bright stars that are smaller and fainter than supergiants.
The Hertzsprung-Russell Diagram Below the main sequence in the lower part of the H-R diagram are white dwarfs. • A white dwarf is the small, dense remains of a low- or medium-mass star. • White dwarfs are hot but dimmer than main-sequence stars of the same temperature.
The Hertzsprung-Russell Diagram The diameter of a red giant is typically 10–100 times that of the sun and more than 1000 times that of a white dwarf.
Assessment Questions • What is the unit of distance that scientists use to measure distances between the solar system and other stars? • astronomical unit • parallax • stellar unit • light-year
Assessment Questions • What is the unit of distance that scientists use to measure distances between the solar system and other stars? • astronomical unit • parallax • stellar unit • light-yearANS: D
Assessment Questions • The stars with the highest surface temperatures can be identified because they are • the brightest stars in the sky. • moving away from Earth. • the most massive. • blue.
Assessment Questions • The stars with the highest surface temperatures can be identified because they are • the brightest stars in the sky. • moving away from Earth. • the most massive. • blue.ANS: D
Assessment Questions • What two characteristics of main sequence stars show an approximately linear relationship on the Hertzsprung-Russell diagram? • mass and volume • absolute brightness and the percentage of helium in the star • diameter and surface temperature • surface temperature and absolute brightness
Assessment Questions • What two characteristics of main sequence stars show an approximately linear relationship on the Hertzsprung-Russell diagram? • mass and volume • absolute brightness and the percentage of helium in the star • diameter and surface temperature • surface temperature and absolute brightnessANS: D