Download
1 / 26
260 likes | 270 Views
Symposium on Assessment of Trade in Services World Trade Organization 14-15 March 2002. WTO Statistics Division Statistics@WTO.org. Trends in Services Trade under GATS Recent Developments. To which extent can statistics help in the Assessment of Trade in Services ?.

E N D
Symposium on Assessment of Trade in ServicesWorld Trade Organization 14-15 March 2002 WTO Statistics Division Statistics@WTO.org Trends in Services Trade under GATS Recent Developments
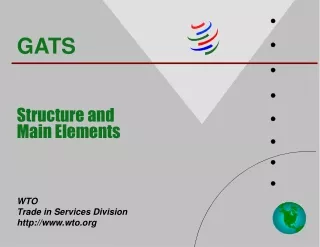
To which extent can statistics help in the Assessment of Trade in Services ? • Major relevant Statistical Frameworks • Statistics on Domestic Economic Activity • Sectoral Statistics/Quantitative Indicators • Balance of Payments Statistics • Foreign Affiliates Trade in Services (FATS) Statistics • Statistics and Modes of supply • Specialization Indicators • Conclusions
Economic activity Statistics on Domestic Economic Activity Sources National Accounts, employment statistics, business statistics Examples of information Output, value added, number of employees, turnover Why relevant? Information on market size, competitiveness, employment generation Who collects? Country comparable statistics are collected by UN, OECD, IMF, and Eurostat, but national sources are much richer
Economic activity Share of Services Value Added in GDP Selected Countries, 1999
Economic activity Share of Services Value Added in GDP by Economic Groups percent Developed countries World Developing countries
Quantitative indicators Quantitative Indicators • Coverage • Sector-specific quantitative information • Examples of specific services sectors • Transport: persons or cargo transported • Telecommunication: minutes of international telephone traffic • Why relevant? • No price distortion. Meaningful, because specifically defined for the sector in question • But ... • Do not provide for comparability across sectors
Quantitative indicators International Telecommunication Transactions and Minutes of International Telephone Traffic BOP imports and exports International telephone traffic Note: : International telecommunication transactions (BOP imports + exports)represent mostly payments between telecommunication operators for termination services
Quantitative indicators Tourist Arrivals and BOP Travel Exports France, Italy and Spain International tourist arrivals Travel exports in€ Travel exports in$
BOP Balance of Payments Statistics Coverage Transactions between residents and non residents on goods, services, income, transfers, financial claims, and liabilities Concepts & definitions 5th edition of IMF BOP Manual (BPM5) Why relevant? Information on international trade in services is widely comparable across countries Who collects? IMF, OECD, and Eurostat at the international level
BOP Goods Services GDP
Exports of Commercial Services by Economic Groups - Shares in Total BOP Developing countries Developing countries 1990 1995 25% 75% Developed countries Developed countries Developing countries 2000 Developed countries
BOP Commercial Services Exports Shares by Regions
BOP BPM5 Major Services Categories Commercial services: 1. Transport 2. Travel 3 -10 Other commercial Services 3. Communication services 4. Construction services 5. Insurance services 6. Financial services 7. Computer and Information services 8. Royalties and licence fees 9. Other business services 10. Personal, cultural and recreational services 11. Government services
BOP Structure of Commercial Services Exports 45% 37% 34% 32% 29% 23%
43% 10% 3% 4% 13% 14% 3% 10% BOP Structure of Other Services Exports, 1998
FATS Foreign Affiliates Trade in Services (FATS) Statistics • Information covered • Operations of foreign affiliates, such as turnover and employment • Direction of trade • Inward : activity of foreign affiliates in the compiling economy • Outward: foreign affiliates of the compiling economy that are established abroad • Concepts & definitions • Manual on Statistics of International Trade in Services • Foreign Affiliates are those affiliates in which the foreign investor holds a majority of the ordinary shares or voting power • Why relevant ? • Provides information on GATS mode 3 - commercial presence
Share of Services Turnover of Foreign Affiliates in National Total - Selected Countries FATS
Modes Sales by GATS Modes of Supply: Statistical Approximation
Indicators Specialization Indicators • Often named specialization ratios, comparative advantage, or export specialization • generally defined as the ratio of exports of a service category to total exports of services, or goods and services, or GDP; often relative to the average value for all countries • Can be computed for countries, or country groups, and at the level of modes of supply, using proxies • Limitations should be recognized when interpreting results (lack of country coverage, data reliability, classification detail)
Indicators Commercial Services minus Travel (Mode 1)Major Exporters and Export Specialization, 2000 Major exporters Export specialization Billion US$ % (relative to exports of commercial services)
Indicators Travel Services (Mode 2) Major Exporters and Export Specialization, 2000 Major exporters Export specialization Billion $ % (relative to exports of commercial services)
FDI Stock in Services (Mode 3 proxy) OECD, Major Host Countries (inward) and Outward Specialization, 1999 Indicators Inward FDI stock, major countries Outward FDI stock, specialization (%, relative to GDP) Billion $
Indicators Compensation of Employees (Mode 4 proxy) Major Importers and Export specialization, 2000 Major importers Export specialization Billion $ % (relative to exports of commercial services)
Trade in Services Statistics:Recent Improvements Conclusions Statistics were dramatically improved recently: BOP • Thanks to BPM5, now detailed services categories are available • Thanks to MSITS, more detailed categories will be available • Concepts, definitions and classification available (MSITS) • Data collection started in many countries • The bulk of services transactions covered by GATS may be assessed FATS Modes • BOP and FATS are a first step in providing information by modes of supply
Conclusions Trade in Services Statistics :Remaining Weaknesses Statistics still need to be dramatically improved: • BOP statistics lack reliability for detailed categories • Documentation on data coverage and deviations from standards is rarely available • detailed categories are not reported by all countries BOP FATS • Lack of reliability due to the infancy stage of FATS statistics • Lack of comparability across countries • Developing countries have not started compilation yet Modes • There is no one-to-one correspondence between statistics and modes of supply
Conclusions The Task Force on Statistics of International Trade in Services • The Task Force completed the Manual on Statistics of International Trade in Services • The Manual will be published by the UN very soon; it is available on the UN and OECD web pages • The Task Force will now focus on compilation guidance