Download
1 / 17
310 likes | 1.01k Views
Ordered Pairs and the Coordinate Graph. Cartesian Plane. The Cartesian Coordinate Plane. The Cartesian plane was the brainchild of French mathematician Rene Descartes trying to combine algebra and geometry together.

E N D
Ordered Pairs and the Coordinate Graph Cartesian Plane
The Cartesian Coordinate Plane The Cartesian plane was the brainchild of French mathematician Rene Descartes trying to combine algebra and geometry together.
To explain Descartes method, first think of using a map. If you are trying to find a specific location you use reference points around the outside of the map and trace down and across to find your location. It’s like using longitude and latitude.
You learned about basic (counting) number lines back in elementary school.Later on, you were introduced to zero and negatives, which completed the number line.Descartes took a second number line and standing it on end, crossed the lines at zero to form a grid like pattern.
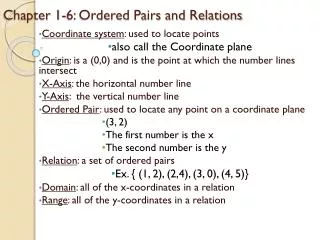
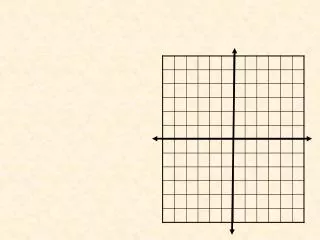
The number lines when drawn like this, are called “axes”. The horizontal line is called the “x-axis”; the vertical line is called the “y-axis”.By the way, the arrows at the ends of the axes indicate the direction in which the numbers are getting larger.
Each coordinate plane is divided into quadrants. Using the “ordered pairs” or the x- and y-axes you can find a point on the plane.
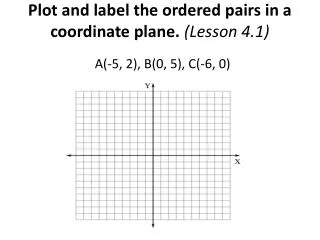
To plot an ordered pair, begin at the origin, the point (0, 0), which is the intersection of the x-axis and y-axis.The first coordinate tells how many units to move left or right; the second coordinate tells how many units to move up and down.
X-coordinate move right or lefty-coordinate move up or down(x, y)The sign of the number indicates which direction to move.Positive: up or rightNegative: down or left
order pairs – a pair of numbers used to locate a point on a coordinate plane.coordinate plane – a plane formed by the intersection of a horizontal number line called the x-axis and a vertical line called the y-axis.x-axis – the horizontal axis on a coordinate plane.y-axis – the vertical axis on a coordinate plane.x-coordinate – the first number in an ordered pair; it tells the units to move right or left from the origin.y-coordinate – the second number in an ordered pair; it tells the units to move up or down from the origin. More definitions
origin – the point where the x-axis and the y-axis intersect on the coordinate plane.graph of an equation – the set of all ordered pairs that are solutions of the equation.dependent variable – the y-coordinate of an equation, which depends on what the x-value will be. (in the equation y = 2x, the y-value depends on what the value of x is.)independent variable – the x-coordinate of an equation, which when substituted will determine what the y-value will be. (in the equation y = 2x, the value of x will determine what the value of y equals)
Draw this coordinate plane on graph paper and label all parts.
Graphing an Equation Using ordered pairs
The good, the bad and the ugly. When graphing you always use graph paper and draw neatly.NO HAND DRAWN GRAPHS
Complete the table of values to determine the ordered pairs. Graph the equation on a coordinate plane.
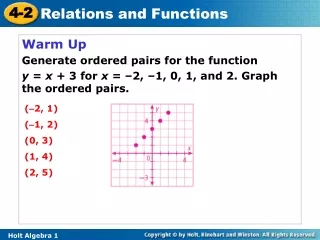
Make a table of values for the following equations and graph each on the coordinate graph.y = x + 1 y = 3x y = 2x - 1
Cartography, the science of map making, is an application of graphing on a coordinate plane. Cartographers map a region of the surface of the earth onto part of a plane.