Download

1 / 23
540 likes | 1.34k Views
Churn. michel.bruley@teradata.com. Extract from various presentations: Owens, Telecom Lab, Aster Data … . January 2013. Churn in Comm. Industry: a bottom line issue. Attracting thousands of new subscribers is worthless if an equal number are leaving

E N D
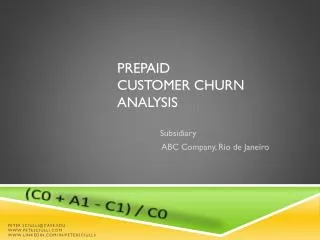
Churn michel.bruley@teradata.com Extract from various presentations: Owens, Telecom Lab, Aster Data … January 2013
Churn in Comm. Industry: a bottom line issue • Attracting thousands of new subscribers is worthless if an equal number are leaving • Minimizing customer churn provides a number of benefits, such as: • Minor investment in acquiring a new customer • Higher efficiency in network usage • Increase of added-value sales to long term customers • Decrease of expenditure on help desk • Decrease of exposure to frauds and bad debts • Higher confidence of investors
Churn: Why Customers Leave How can I effectively manage customer churn? Why are my customers churning? How do I identify key churn drivers across the customer lifecycle? How can I predict when my customers will churn? What kind of initiatives can I run to anticipate customer churn and address drivers of churn? How do I report on churn and retention initiatives?
Churn management: scoping the problem (1) • Churn can be defined and measured in different ways • “Absolute” Churn. number of subscribers disconnected, as a percentage of the subscriber base over a given period • “Line” or “Service” Churn. number of lines or services disconnected, as a percentage of the total amount of lines or services subscribed by the customers • “Primary Churn”. number of defections • “Secondary Churn”. drop in traffic volume, with respect to different typology of calls
Churn management: scoping the problem (2) • Measuring churn is getting more and more difficult • Growing tendency for Business users to split their business between several competing fixed network operators • Carrier selection enables Residential customers to make different kind of calls with different operators • Carrier pre-selection and Unbundling of the Local Loop makes it very difficult to profile customers according to their “telecommunication needs” • Other frequent questions for Fixed Network Services • What if a customer changes his type of subscription, but remains in the same telco? What if the name of a subscriber changes? What if he relocates?
The case: Churn Analysis for wireless services • The framework • A major network operator willing to establish a more effective process for implementing and measuring the performance of loyalty schemes • Objectives of the “churn management” project • Building a new corporate Customer Data Warehouse aimed to support Marketing and Customer Care areas in their initiatives • Developing a Churn Analysis system based upon data mining technology to analyze the customer database and predict churn
Business understanding • Sponsors • Marketing dept., IT applications, IT operations • Analysis target • Residential Customers, subscriptions • Churn measurement • Absolute, primary churn • Goal: • Predict churn/no churn situation of any particular customer given 5 months of historical data
Solution scope millions of residential customers Usage patterns analysis of Voice Services by single subscriber line millions of business customers Usage patterns analysis of Voice Services by subscriber line, contract, company, etc. millions of customers Usage patterns analysis of VAS by single subscriber line
Data Server Data Warehouse Data Preprocessing ETL ... ... Loader ... Listener Loader Decision Engine Loader Data Collection & Transformation Application framework Reporting OLAP Data Mining Marketing • Campaign Targets • New product / services • Loyalty schemes • Performance analysis Analytical Applications Marketing automation Service automation Sales automation Customer data Market data Sales data Customer service contacts Contracts Tariff plans Billing data Accounts data Fraud / Bad debts data Front-office Systems Back-office Systems
Input Data • Customer demographics • Basic customer information • Service Profile • Products/services purchased by each customer. • Tariff plans • Details of the tariff scheme in use • Extra service information • Special plans / rates • Service bundles • Call data aggregated by month • Billing data aggregated by month • Complaint information • Fraud and bad debts data • Customer service contacts • Sales force contacts • Market data xx operational systems • More than 500 indicators per customer • Loading: on a monthly basis • Size: xTB Customer Data Warehouse Data understanding
Modeling with Data Mining tool • Main steps • Define Concepts, Attributes, Relationships … • Select Operators • Build the execution workflow
Concepts, Attributes, Relationships Call data records Data about subscribed services Demographic attributes Revenue data
16 Raw attributes 45 Derived attributes Construction stage output Data Construction Feature Selection
Churn modeling chain 4 Predictive models, one for each customer segment Medium value customers are selected training set decision tree operator applied to fit predict the likelihood of a customer to become a churner in the month M6 Save output
What Is Graph Analysis? Aster: MapReduce implementations for graph analysis • Operates on Any Transaction or Interaction Data • Identifies the individuals or nodes in a network • Identifies the relationships or edges in a network • In-Memory Graph Structure Allows for Graph Analytics • MapReduce creates a graph object that can then be traversed for analysis • Traversal of the graph is non-trivial even for simple graph analysis • Output of Graph Analysis Is Flexible • MapReduce used to dynamically bind structure to data on execution
Teradata Aster Graph Analysis Why this belongs on Aster Limitations in SQL Relational DBMSs Set-based SQL is a poor programming construct for Graph problems Every connection between 2 people is a self-join in SQL Aster Advantages Read & transform data into in-memory graph structure Perform standard SQL logic or MapReduce on the in-memory graph structure Influencer Analytics: traverse the graph for single shortest path – six degrees of Kevin Bacon Aster Metrics: Social Graph Analysis Environment: 1 billion rows, 700GB, 11 workers Aster Response: 180 Seconds
Graph Analysis & Churn Prediction Graph Analysis constructs an influence propagation model - Given persons who churned (initial churners) - Diffuse their influence into their social environment - Thus, their friends are at a larger churn risk.. (The two C1s churn; N does not) - And this propagates to some of their friends’ friends (C2 affected due to indirect, cumulative influence) Output - List of predicted churners Business Value - Captures higher order social effects - Capture the effect of multiple churners on a subscriber - Does not require profile information - Once the model is created, it can be run quickly & often - Complements traditional churn models Indirect influence Influence spreading C1 * I I * * N C1 C2 I Initial churners (known) Predicted churners C
Understand customers paths to service cancellation Multi-Channel Path Analysis Identify most frequent paths to early termination of service Analyze specific patterns of customer behavior Across multiple channels of customer engagement – web, retail, customer service
Customer Journey across Multiple Channels call drop outs data drop outs in web (PDP) sessions *nPath analysis Propensity-to-churn model Path to churn level of call quality (voice and data speed) Customer experience score Propensity to churn 3G to 2G drop down and length of time on 2G. Good Score = Upsell opportunity Bad Score = Retention Activities Variation Score = Explanatory Message/Action sentiment analysis from call center records *nPath - pre-packaged SQL-MapReduce function for finding sequences of events
Detect & Prevent Customer Churn • Big Data & Churn Prevention • Enrich Traditional Churn Model • Graph Analysis • Multi-Channel Path Analysis • Business impact • With significantly less effort, know when customers are in the last mile of considering leaving • Higher customer retention leading to lower costs and higher profitability • Higher customer satisfaction