Download
1 / 23
230 likes | 235 Views
Learn about the impact of economic volatility, GDP growth, global industrial production, merchandise exports, exchange rates, inflation rates, interest rates, and political risk on trade credit risk. Gain insights to navigate uncertain trade environments.

E N D
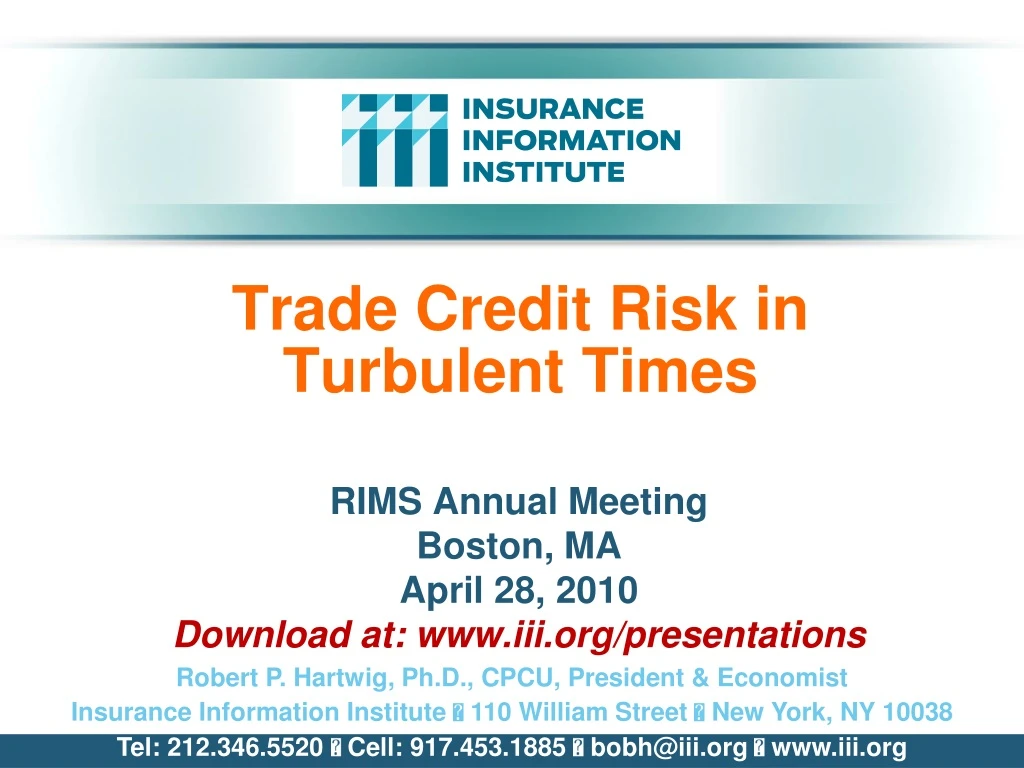
Trade Credit Risk in Turbulent Times RIMS Annual Meeting Boston, MA April 28, 2010 Download at: www.iii.org/presentations Robert P. Hartwig, Ph.D., CPCU, President & Economist Insurance Information Institute 110 William Street New York, NY 10038 Tel: 212.346.5520 Cell: 917.453.1885 bobh@iii.org www.iii.org
Economic Volatility A Halting Global Recovery is Underway; Volatility Remains 3
World Economic Outlook: 2010-2011P IMF says growth in emerging and developing economies will outpace advanced ones in 2010/11. Outlook uncertain: The world economy is recovering from the global crisis better than expected, but activity is reviving at different speeds in different parts of the world, according to the IMF. This means trade credit risk will vary regionally and by industry. Sources: IMF, World Economic Outlook; Insurance Information Institute. 4
GDP Growth: Advanced & Emerging Economies vs. World, 1970-2011F Emerging economies (led by China) are expected to grow by 6.0% in 2010 GDP Growth (%) World output is forecast to grow by 3.9% in 2010, following a -0.8% drop in 2009. Advanced economies will grow slowly in 2010, dampening energy demand Source: International Monetary Fund, World Economic Outlook Update, Jan. 26, 2010; Ins. Info. Institute.
Global Industrial Production Rebounds From a Tailspin; Global Trade Recovering Annualized 3-Month Percent Change Global industrial production was down over 25% in early 2009, severelt curtailing global trade, but growing at a 9% clip in late 2009 Source: International Monetary Fund, World Economic Outlook Update, Jan. 26, 2010; Ins. Info. Institute.
Merchandise Exports Are Growingat Pre-Crisis Levels Again Annualized % change of 3-month moving average over previous 3-month moving average Global trade crashed during the financial crisis. Seizure of credit markets contributed significantly to the crash. Note: data are through November 2009Source: International Monetary Fund World Economic Outlook January 2010 update at http://www.imf.org/external/pubs/ft/weo/2010/update/01/data/figure_2.csv 7 12/01/09 - 9pm eSlide – P6466 – The Financial Crisis and the Future of the P/C
Global Industrial Production and Exports: 2006 to 2011P Global trade crashed during the financial crisis. Seizure of credit markets contributed significantly to the crash. (Annual Percent Change of 3-Moving Average) Source: International Monetary Fund, January 2010; Insurance Information Institute. 8
Exchange Rates, Inflation and Interest Rates Pace of Recovery and Government Monetary and Fiscal Policies Influence Exchange and Inflation Rates, Impacting Trade Credit Risk and Cost 9
Trade Index Weighted US Dollar Exchange Rate* January 2000 through March 2010 Depreciation of dollar after Tech bubble and post 9-11 Post-crisis depreciation of dollar Dollar appreciates as role as global “reserve currency” affirmed during global financial crisis The Global Financial Crisis Produced Significant Exchange Rate Volatility in 2008 and 2009; Despite the Fact that the Crisis Originated in the US, it Was Other Currencies That Weakened *The broad index is a weighted average of the foreign exchange values of the U.S. dollar against the currencies of a large group of major U.S. trading partners. The index weights, which change over time, are derived from U.S. export shares and from U.S. and foreign import shares. Source: US Federal Reserve, Board of Governors; Insurance Information Institute.
Inflation Rates for Largest European Economies & Euro Area, 2008-2011F Inflation is below 1.5% across major European economies and interest rates remain low as a result, obscuring tight conditions in trade credit markets % Change from Prior Year Source: Blue Chip Economic Indicators, 3/10/10 edition.
3-Month Interest Rates forMajor Global Economies, 2008-2011F Interest rates remain generally low in much of the world, depressing insurer investment earnings. But rates are often held low by government action and lingering economic weakness, obscuring tight conditions in trade credit markets Source: Blue Chip Economic Indicators, 3/10/10 edition.
Internationally, Most Short-termInterest Rates Are Still Quite Low *reduced from 5.75%Source: http://www.fxstreet.com/fundamental/interest-rates-table/
Political Risk Many Nations Suffer from Political Instability, Fundamentally Influencing Trade Credit Risk 14
Aon: 2010 Political Risk Map Political and financial instability remain a feature of the business landscape in 2010 due to the recession, according to Aon. Source: Aon 15
Aon 2010 Political Risk Map: Findings Elevated Political Risk Levels to Continue in 2010 Significant volume of credit and political risk claims in international insurance markets have driven many of the 18 country downgrades in this year’s map. Aon believes 2010 will see elevated political risk levels continue before an overall tendency for improving global business conditions becomes established. For many companies and across different sectors, including credit and political risk insurance, the business environment remains uncertain when trading with or investing in politically or economically unstable countries. Movements on the 2010 Map A total of 18 countries have seen conditions worsen leading to a downgrade: Algeria, Argentina, El Salvador, Equatorial Guinea, Ghana, Honduras, Kazakhstan, Latvia, Madagascar, Mauritania, Philippines, Puerto Rico, Seychelles, Sudan, United Arab Emirates, Ukraine, Venezuela and Yemen. Sudan, Venezuela and Yemen have been added to the Very High category, joining Afghanistan, Congo DRC, Iran, Iraq, North Korea, Somalia and Zimbabwe. Eight countries/territories have been upgraded to a lower risk level - Albania, Myanmar/Burma, Colombia, South Africa, Sri Lanka, East Timor, Vanuatu, Vietnam and the Hong Kong Special Administrative Region of the People's Republic of China. Bottom Line: Political and financial instability remain a feature of the business landscape in 2010 as a result of the recession. Source: Aon 16
A.M. Best: Country Risk Evaluation* 10 of the 76 countries evaluated by A.M. Best are in the most at-risk category. Country risk is factored into all A.M. Best ratings. Countries that pose the most risk and therefore greatest challenge to an insurer’s financial stability, strength and performance (CRT-5) are: Belarus, Bosnia and Herzegovina, Dominican Republic, Ghana, Jamaica, Kenya, Lebanon, Nigeria, Ukraine and Vietnam, according to A.M. Best. *A.M. Best defines country risk as the risk that country-specific factors could adversely affect an insurer’s ability to meet its financial obligations. Countries are placed into one of five tiers, ranging from Country Risk Tier 1 (CRT-1) denoting a stable environment with the least amount of risk, to Country Risk Tier 5 (CRT-5) for countries that pose the most risk and greatest challenge to an insurer’s financial stability, strength and performance Source: A.M. Best., AMB Country Risk Report, Sept. 2009.
Countries by Risk Tier Rating CRT-5 Belarus Bosnia and Herzegovina Dominican Republic Ghana Jamaica Kenya Lebanon Nigeria Ukraine Vietnam CRT-4 Antigua & Barbuda* Brunei Darussalam Egypt India Indonesia Jordan Kazakhstan Mauritius Morocco Panama Philippines Russia Tunisia Turkey CRT-3 Bahamas* Bahrain China Cyprus Israel Kuwait Malaysia Malta Mexico Netherlands Antilles* Oman Poland Qatar Saudi Arabia South Africa Thailand Trinidad and Tobago United Arab Emirates CRT-1 Australia Austria Canada Denmark Finland France Germany Gibraltar* Guernsey* Isle of Man* Luxembourg Netherlands Norway Singapore Sweden Switzerland United Kingdom United States CRT-2 Barbados* Belgium Bermuda British Virgin Islands* Cayman Islands* Hong Kong Ireland Italy Japan Liechtenstein* Macau New Zealand Slovenia South Korea Spain Taiwan *Denotes countries to be considered “Special Cases” by A.M. Best Source: A.M. Best., as of 4/13/10 18
Trade Credit Risk: Summary & Outlook Complex Array of Economic, Financial and Political Factors Will Buffet Trade Credit Markets for Years to Come 19
Top 10 Risks & Reported Readiness and Losses: Many Impact Trade Credit Risk* *Yellow shading denotes risks with greater impact to trade credit risk. Source: Aon Analytics; Global Risk Management Survey; Insurance Information Institute commentary of trade credit risk.
Financial Crisis Increases Demand for Trade Credit Insurance • Financial crisis has led to significant increased demand for trade credit insurance cover • Banks and other trade financiers had to take measures during the crisis which resulted in increased pressure on suppliers’ credit terms and high risk scenarios • Trade credit insurers continued to support their customers during the crisis, illustrated by: 20 million running credit limits; insured exposures at EUR 1.8 trillion; claims ratio before costs of around 84 percent for 2009 (pre-crisis 40-60 percent) • Available capacity not affected by the crisis, but pre-crisis terms no longer available • Insurers increase information sharing and transparency • High policy renewals of around 80-90 percent confirm customer satisfaction with their insurance partners • Increased information sharing and transparency will be provided to customers. Emphasis on “added value” of insurers’ risk management role and higher transparency re credit limit decisions • Outlook • Continued availability of trade credit insurance cover gives confidence and security during fragile economic recovery • Cost of capital and tightened risk environment continues to challenge industry, leading to higher premium rates and stricter conditions Bottom Line: Market now stable, but still challenging situation Source: International Credit Insurance & Surety Association, April 2010 21
Trade Credit Insurance Marketplace Trade credit insurance market is concentrated in the hands of a few Total global annual premium income was over $8 billion in 2008 Three major monoline credit insurers account for nearly 90 percent of market: Euler Hermes (36%); Atradius (31%); Coface (20%). Backed by reinsurers Other companies involved include: Chartis, QBE, various Lloyd’s syndicates and ACE, as well as govt-backed export credit agencies Exposures rise, but premium growth lags In past five years exposure levels of major credit insurers saw massive growth as they competed for market share Premium income has not grown at same rate because of price competition and increased writing of marginal risks by insurers Risk/reward imbalance Economic downturn takes its toll Persistent economic downturn with retrenchment of bank credit, drying up of letters of credit results in significant rise in payment defaults and corporate failures These conditions have led to significant increase in claims and record high loss ratios for major three insurers in 2009 A capacity problem could follow in 2010 if reinsurance capacity shrinks or becomes price prohibitive Source: Marsh: Trade Credit Insurance and the Global Credit Crisis, 2009; Insurance Information Institute (I.I.I.) 22
Trade Credit Insurance Marketplace Insurers refocus on risk quality Credit insurers review and reduce exposures/limits on certain industry sectors and countries of concern Industry sectors considered difficult by most credit insurers include: construction, retail, commodities, electronic consumer goods, automobiles and transport Dramatic premium increases for loss-making policies. Some not renewed at any price. Insurers will not take on risk deemed to be volatile or unprofitable Alternatives for insurance buyers Top-up cover, other insurers, accounts receivable purchase agreements and govt support some of the alternatives buyers are exploring Small market for top-up cover, but not in all regions Insureds with strong credit and ability to retain risk exploring increased use of captive insurers Government-backed options offer limited support in some countries, but at a cost Bottom Line: In 2010 challenging conditions remain, but receding recession should improve loss situation for trade credit insurers Source: Marsh: Trade Credit Insurance and the Global Credit Crisis, 2009; Insurance Information Institute (I.I.I.) 23
Insurance Information Institute Online: www.iii.org Thank you for your timeand your attention! Twitter: twitter.com/bob_hartwig Download at: www.iii.org/presentations