Download
1 / 21
210 likes | 212 Views
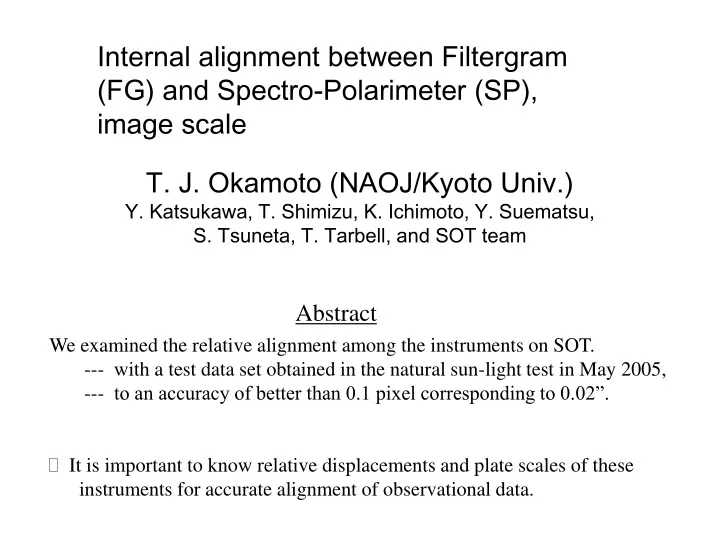
This presentation examines the relative alignment between Filtergram (FG) and Spectro-Polarimeter (SP) instruments, including displacements and plate scales, using a test data set obtained in May 2005. Accurate alignment of observational data requires understanding the relative displacements and plate scales of these instruments.

E N D
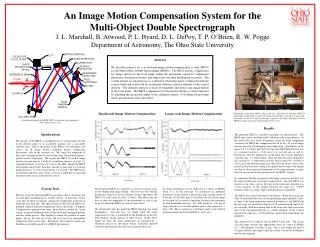
Internal alignment between Filtergram (FG) and Spectro-Polarimeter (SP), image scale T. J. Okamoto (NAOJ/Kyoto Univ.) Y. Katsukawa, T. Shimizu, K. Ichimoto, Y. Suematsu, S. Tsuneta, T. Tarbell, and SOT team Abstract • We examined the relative alignment among the instruments on SOT. • --- with a test data set obtained in the natural sun-light test in May 2005, • --- to an accuracy of better than 0.1 pixel corresponding to 0.02”. • It is important to know relative displacements and plate scales of these instruments for accurate alignment of observational data.
Overview The main contents in this presentation are the following: 1. Relative alignment of Filtergram (FG) images a. Displacements and plate scales among Broadband Filter Imagers (BFIs) and Narrowband Filter Imagers (NFIs) b. Dependence on focus position 2. Relative alignment of Spectro-Polarimeter (SP) Images a. Displacements and plate scales between SP and NFI b. Uniformity of scanning steps FG SP BFI NFI alignment 5550 5576 3883 4504 5172 6302 6302 3968 6684 5250 6563 4305 5896 (Angstrom)
1(a). Relative alignment of FG images The grid pattern was located at the secondary focus of the simulated Optical Telescope Assembly (OTA). The images of the pattern were taken through all the filters of FG. We measured positions of all the crosses in the grid pattern, and derived relative displacements and plate scales. FG image (BFI) 1024 pix 2048 pix overview FPP Re-imaging lens grid Solar light CLU (Collimator Lens Unit) Pinhole-array
Relative alignment of FG images (BFI) E BFI images • Determine grid positions for each filter • Plot relative displacements of the grid positions with respect to the positions on the 5550A image • Calculate average displacements (DX, DY) between two filters by averaging the relative shifts of the grid positions • Correct the average displacements, and then plot the grid positions again • Get difference of the pixel scale among the images with respect to the 5550A image N CN bandhead 3883 blue cont 4504 green cont 5550 Ca II H line 3968 G band 4305 red cont 6684 y 1024 pix x 2048 pix (Focus = 2009) (date = May 26)
Relative alignment of FG images (BFI) • Determine grid positions for each filter • Plot relative displacements of the grid positions with respect to the positions on the 5550A image • Calculate average displacements (DX, DY) between two filters by averaging the relative shifts of the grid positions • Correct the average displacements, and then plot the grid positions again • Get difference of the pixel scale among the images with respect to the 5550A image
Relative alignment of FG images (BFI) • Determine grid positions for each filter • Plot relative displacements of the grid positions with respect to the positions on the 5550A image • Calculate average displacements (DX, DY) between two filters by averaging the relative shifts of the grid positions • Correct the average displacements, and then plot the grid positions again • Get difference of the pixel scale among the images with respect to the 5550A image • These shifts are due to wedge of each filter. • (because only filters are different in the • optical system) • This can be easily corrected.
Relative alignment of FG images (BFI) • Determine grid positions for each filter • Plot relative displacements of the grid positions with respect to the positions on the 5550A image • Calculate average displacements (DX, DY) between two filters by averaging the relative shifts of the grid positions • Correct the average displacements, and then plot the grid positions again • Get difference of the pixel scale among the images with respect to the 5550A image wavelength-dependent image shift (averaged) removed color aberration difference of plate scale
Relative alignment of FG images (BFI) • Determine grid positions for each filter • Plot relative shifts of the grid positions with respect to the positions on the 5550A image • Calculate average displacements (DX, DY) between two filters by averaging the relative shifts of the grid positions • Correct the average displacements, and then plot the grid positions again • Get difference of the pixel scale among the images with respect to the 5550A image color aberration (difference of plate scale) X-axis Y-axis Grid position displacements Grid position displacements Grid position in X (pix) Grid position in Y (pix) Relative plate scale As the wavelength is longer, the plate scale is smaller.
Relative alignment of FG images (NFI) wavelength-dependent image shift (averaged) removed The grid images taken with NFI were processed with the same procedure as with BFI. Average displacements Relative plate scale Similar to BFI, as the wavelength is larger, the plate scale is smaller.
Relative alignment of FG images (between BFI and NFI) The relative displacement of central grids of BFI 5550A with respect to NFI 5576A. BFI NFI The relative plate scale among the images of BFI (5550A) and NFI (5576A). 0.6732 (designed: 0.6750) !!! Remaining issue: absolute plate scale
1(b). Alignment depending on Focus Position The following figures show the displacements of the grid points in the X-direction as a function of the focus positions. The displacements represent the shifts from the grid positions obtained at focus position 2009. The images taken with BFI 5550A and NFI 5576A are used here. Only the grids in the middle row are plotted in these figures. • We notice 2 features from the figures: • periodic variations with an amplitude of several pixels in a period of 18. • change of plate scales: the distance between two grids of the images becomes smaller as the focus position is larger. This means the plate scale is larger at the larger focus positions. BFI NFI right left (arbitrary position) This variation is due to change of shift of lens as the position of focus is moved. However, it is regardless because it is rarely moved during observations. (it is needed to correct the alignments again when we adjust the focus)
2. Relative alignment of SP images We examine the plate scale and alignment of SP along the slit and in the direction of scanning with respect to NFI. SP data is scanned on the FOV with 101 steps (slit position: -1000~1000 at intervals of 20). We select one wavelength of SP and make an image that has 101x1024 pix size. This figure indicates an NFI image that is scanned on the FOV of NFI 6302A image with 101 uniform steps at intervals of 20. SP data NFI data 1024 pix 0 1 2 3 4 5 ・・・ 101 101 pix FOV According to these figures, the scanned steps of SP are non-uniform and the plate scale of SP and NFI is different because of … ・・・・・・・・・ (1) Distortion of NFI image -1000 -500 0 500 1000 (2) Rotation (3) Uniformity of scanning steps
Relative alignment of SP images (1) distortion of NFI image From NFI image, we can see it distorted by analyzing details. So, we compared observed grids with even interval grids. even interval grids
Relative alignment of SP images (1) distortion of NFI image Figure shows the degree of distortion of NFI as a function of a distance from the central point (1023.5, 511.5) of the image. Distortion is larger near the edge of FOV. r+dr (obs.) r (even interval grids) (r+dr)/r (2) rotation r The NFI image is rotated with respect to SP. The angle is 0.2 degree counterclockwise. NFI 0.2° It is needed to correct when we analyze the data. SP
Relative alignment of SP images SP data (3) uniformity of scanning steps Using vertical lines, we examined the position on NFI image of each slit of SP. The result is shown. According to these figures, we can see the non-uniformity of scanning steps --- the periodic residual component. To measure them with higher accuracy, it is necessary to analyze data having smaller step size than 20 steps. NFI data These results in this presentation are obtained with the data set in May 2005. We have new data set in 2006 with new optical system. We are analyzing them and the new results will be shown in the next time.
Summary We know the platescale and displacement of each filter, it is possible to align all data each other. FG SP BFI NFI 5550 5576 distortion rotation 3883 4504 5172 6302 6302 3968 6684 5250 6563 4305 5896 alignment (platescale, displacement) There is a remaining issue: “absolute platescale.”
displacement platescale X X Y Y
Relative alignment of FG images (BFI) 40 pix • Determine grid positions for each filter • Plot relative shifts of the grid positions with respect to the positions on the 5550A image • Calculate average displacements (DX, DY) between two filters by averaging the relative shifts of the grid positions • Correct the average displacements, and then plot the grid positions again • Get difference of the pixel scale among the images with respect to the 5550A image integration of intensity along the vertical axis on each horizontal point 2nd order fitting (to an accuracy of better than 0.1 pixel)
Relative alignment of FG images (BFI) • Determine grid positions for each filter • Plot relative shifts of the grid positions with respect to the positions on the 5550A image • Calculate average displacements (DX, DY) between two filters by averaging the relative shifts of the grid positions • Correct the average displacements, and then plot the grid positions again • Get difference of the pixel scale among the images with respect to the 5550A image 8 pix circle (1013, 478) grid center
(192, 720) (463, 730) (733, 739) (1003, 748) (1274, 758) (1544, 767) (1815, 777) (202, 450) (473, 459) (743, 469) (1283, 488) (1554, 497) (1825, 506) (211, 179) (483, 188) (753, 198) (1023, 207) (1293, 217) (1563, 226) (1834, 235) Relative alignment of FG images (BFI) • Determine grid positions for each filter • Plot relative shifts of the grid positions with respect to the positions on the 5550A image • Calculate average displacements (DX, DY) between two filters by averaging the relative shifts of the grid positions • Correct the average displacements, and then plot the grid positions again • Get difference of the pixel scale among the images with respect to the 5550A image 8 pix circle (1013, 478) grid center