Download

1 / 5
60 likes | 195 Views
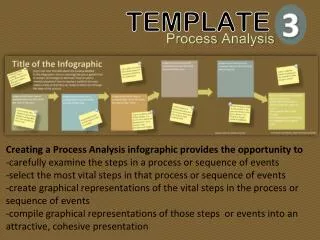
Template. Template. Project Title : Facility:. Diagnostics Report Date:. CHR DOC VERSION: 1. Planned Dates. x x x x x . Key Findings. Initiation. Diagnostics. Solutions. Implementation Planning. Evaluation. Current Performance:. Actual Dates. x x x x x. Gap :.

E N D
Template Template
Project Title : • Facility: Diagnostics Report Date: CHR DOC VERSION: 1 Planned Dates x x x x x Key Findings Initiation Diagnostics Solutions Implementation Planning Evaluation Current Performance: Actual Dates x x x x x Gap: Expected Outcome: Goal Objectives Goal and Objective Case for Change and Key Diagnostic Data Diagnostic Activities Key Messages Stakeholders Patients Project Risks and Issues Variance to Scope
Project Title : • Facility: Highlight planned dates versus actual dates. Any delay should be highlighted in the risks/variance to scope section below and have mitigation strategies. Instructions Diagnostics Report Date: CHR DOC VERSION: 1 Planned Dates x x x x x • Objectives are: • Outcome-based • Focused on achieving the IHI triple aim • Concise • Measurable. • Making no statement of the causes of the problem. • Objectives can be written or graphed on an SPC chart. • If you have more than one measure, the main measure is the one impacted by a change in others: Key Findings Initiation Diagnostics Solutions Implementation Planning Evaluation Current Performance: Actual Dates x x x x x Gap: Expected Outcome: • Goal • Objectives Goal and Objective Main measure Sub measure Sub measure Quantify main comments and feedback from stakeholders. If relevant, break down by specialty / groups, etc. Include sample of stakeholders consulted. Process measure Process measure Case for Change and Key Diagnostic Data Present main patients’ feedback. You can use the 8 dimensions of care / results from stories or surveys / quotes/ process map to support your analysis. Keep a record of interviews separately. Include sample of patients consulted. Briefly present your case for change (why are we changing, what are the benefits and the consequences of not changing?). This section should communicate the pain/urgency to make a change. Highlight connections between data using lines, circles, etc. Use killer facts. Use prioritisation matrix to classify root causes. You can highlight each row in the appropriate colour (red for high priority, green for medium priority and grey for low priority) To print on A3, go to print > printer properties > page size and select A3. Delete the instructions slide once you have completed your report. Impact of these issues on project’s objective(s) Diagnostic Activities • Show the main issues using data. • Use visual cues and graphs. Don’t forget to highlight graphs' key messages. • Include process map/s and highlight key issues / focus areas. • If you would like to present more data / pictures of your activities, etc., you can include an appendix. Present key root cause analysis for each issue (record complete list separately) Key issues identified / major areas of focus prioritised. These issues are the ones that will be taken to the solutions phase. Keep a separate record of your issues log. These issues must be supported by your key diagnostics data and key messages. Changes in focus areas will impact on the objective. Impact of these root causes on key issue. You can use different metrics to support this Key Messages Stakeholders Patients Click on the Pareto chart to open Excel. You can then plug your data directly in the spreadsheet List all the activities undertaken during the diagnostics phase, and the sample size in brackets. You should keep records of the results and be able to provide further information if required Project Risks and Issues Present key risks from your risk register and actionable mitigation strategies. Your risk register should be regularly updated and discussed with your sponsor Name / title and approval date. Approval from sponsor represents validation by steering committee. Variance to Scope Use this section to highlight any change in your scope / objectives from the initiation phase + approval process. Delete this section if N/A