Download
1 / 29
290 likes | 411 Views
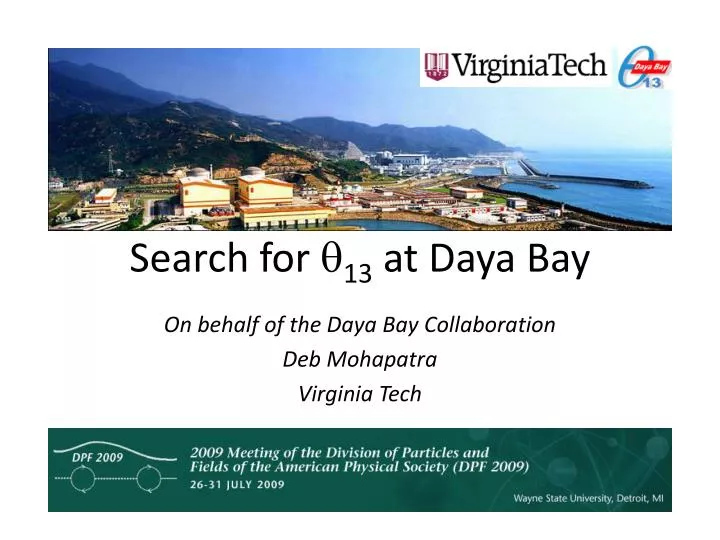
Search for q 13 at Daya Bay . On behalf of the Daya Bay Collaboration Deb Mohapatra Virginia Tech. Outline. The neutrino mixing matrix and the mixing angle θ 13 Reactor neutrino experiments Daya Bay experimental setup Expected signal and background rates

E N D
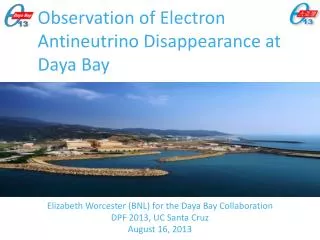
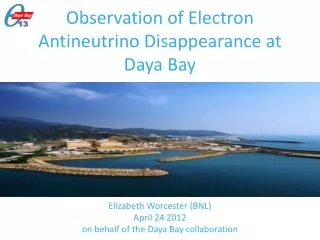
Search for q13 at Daya Bay On behalf of the Daya Bay Collaboration Deb Mohapatra Virginia Tech
Outline • The neutrino mixing matrix and the mixing angle θ13 • Reactor neutrino experiments • Daya Bay experimental setup • Expected signal and background rates • Systematics and sensitivity • Current status • Summary
Atmospheric Reactor Solar The neutrino mixing (MNS) matrix • The MNS matrix relates the mass eigenstates(n1, n2 andn3) to the flavor eigenstates (ne, nmandnt) Last unknown matrix element • It can be described by three 2D rotations Majorana Phases • Ifθ13is zero there is no CP violation in neutrino mixing
Existing limit on q13 Hints for q13 ≠ 0 Global Fit Results Sin2q13 = 0.016 ± 0.010 or Sin22q13 = 0.06 ± 0.04 [ E. Lisi, et al., arXiv: 0905.3549 ] allowed region
Nuclear reactors as antineutrino source • Fission process in nuclear reactor produces huge number of low-energy antineutrino • A typical commercial reactor, with 3 GW thermal power, produces 6×10²⁰νe/s • Daya Bay reactors produce 11.6 GWth now, 17.4 GWth in 2011 From Bemporad, Gratta and Vogel • The observable antineutrino spectrumis the product of the fluxand the cross section Antineutrino spectrum Arbitrary Cross Section Flux
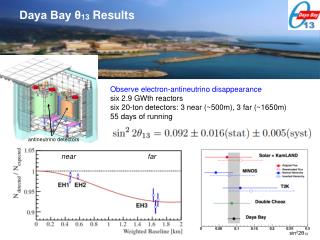
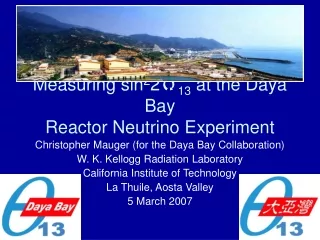
Measuring 13 with reactor antineutrinos Reactor anti-neutrinos survival probability: Small-amplitude oscillation due to 13integrated over E Solar oscillation due to 12 θ13 Δm213≈Δm223 far detector near detector
Daya Bay: Experimental setup Far site Overburden: 355 m Empty detectors: to be moved to underground halls via access tunnel. Filled detectors: to be transported between halls via horizontal tunnels. 900 m Ling Ao Near Overburden: 112 m 465 m Ling Ao II cores Water hall Construction tunnel 810 m Ling Ao cores Liquid Scintillator hall 295 m Entrance Daya Bay Near Overburden: 98 m Daya Bay cores Total tunnel length ~ 3000 m
Far site Overburden: 355 m Ling Ao Near Overburden: 112 m Ling Ao II cores Ling Ao cores Daya Bay Near Overburden: 98 m Daya Bay cores Daya Bay: Experimental setup • 8 identical anti-neutrino detectors ( two at each near site and four at the far site) to cross-check detector efficiency • Two near sites sample flux from reactor groups 9 different baselines under the assumption of point size reactor cores and detectors (Starting 2011) Halls Cores
5 meters 5 meters ~ 12% / E1/2 Antineutrino Detector (AD) • Three-zone cylindrical design • Target: 20 ton 0.1% Gd-doped Liquid Scintillator (LS) • Gamma catcher: 20 ton LS • Buffer : 40 ton (mineral oil) • 192 low-background 8” PMTs • Reflectors at top and bottom • AD sits in a pool of ultra-pure water Calibration System Mineral Oil LS Gd-Loaded LS 1.55 m 1.99 m PMT 2.49 m
Muon veto system Cerenkov Water Pool (2Zone) RPC’s AD PMTs (962) • Two tagging systems to detect cosmic ray and fast neutron background: 2.5 meter thick two-section water shield and RPCs • Efficiency 99.5% with uncertainty <0.25%
Antineutrino event signature in AD Inverse b-decay • Two part coincidence is crucial for background reduction • Neutron capture on Gd provides a secondary burst of light approximately 30 μs later epe+ + n(prompt) + p D + (2.2 MeV) (delayed) ~ 0.3b • + GdGd* Gd+ ’s(8 MeV) (delayed) ~ 50,000b
Measuring 13 with reactor antineutrinos at Daya Bay Measured Ratio of Rates Proton Number Ratio sin22q13 ± 0.3% Storage Tank + flow & mass measurement Near Far
ISO Gd-LS weighing tank filling platform with clean room pump stations Coriolis mass flowmeters < 0.1% load cell accuracy < 0.02% filling “pairs” of detectors 20-ton ISOtank detector Target mass measurement 200-ton Gd-LS reservoir
Measuring 13 with reactor antineutrinos at Daya Bay Measured Ratio of Rates Detector Efficiency Ratio Proton Number Ratio sin22q13 ± 0.3% Storage Tank + flow & mass measurement ± 0.2% Near Far Calibration systems
AD calibration system Automated calibration system → routine weekly deployment of sources LED light sources → monitoring optical properties e+ and n radioactive sources → energy calibration • 68Ge source • Am-13C + 60Co source • LED diffuser ball automated calibration system
6 MeV 1 MeV Prompt Energy Signal Delayed Energy Signal 10 MeV 8 MeV Energy calibration e+ threshold: stopped positron signal using 68Ge source (2x0.511 MeV) e+ energy scale: 2.2 MeV neutron capture signal (n source, spallation) 6 MeV threshold:n capture signals at 8 and 2.2 MeV (n source, spallation) 6 MeV cut for delayed neutrons: 91.5%, uncertainty 0.22% assuming 1% energy uncertainty 1 MeV cut for prompt positrons: >99%, uncertainty negligible
Backgrounds • Fast neutron ─ fast neutron enters detector, creates prompt signal, thermalizes, and is captured • β+n decays of9Li and 8He created in AD via μ - 12C spallation 9Li Antineutrino Signal • Random coincidence ─ two unrelated events happen close together in space and time
Signal, background and systematic • Signal rates: • far site < 90 events/det/day • DayaBay site < 840 events/det/day • Ling Ao site < 740 events/det/day (1%) • Total expected background rates: • far site < 0.4 events/det/day • Daya Bay site < 6 events/det/day • Ling Ao site < 4 events/det/day Systematic and statistical budgets summary
Daya Bay sensitivity to sin22θ13 Sin22θ13 < 0.01 @ 90% CLin 3 years of data taking 2011start data taking with full experimentnominal running period: 3 years
Site preparation staging area surface assembly building tunnel assembly pit cleanroom test assembly assembly pit entrance portal
Fabrication and delivery of detector components detector tank acrylic target vessels
Gd-Liquid scintillatortest production Daya Bay experiment uses 200 ton 0.1% gadolinium-loaded liquid scintillator (Gd-LS). 4-ton test batch production 0.1% Gd-LS in 5000L tank Gd-LS will be produced in multiple batches but mixed in reservoir on-site, to ensure identical detectors.
Summary Daya Bay is the most sensitive reactor 13 experiment. • Daya Bay will reach a sensitivity of ≤ 0.01 for sin2213 • Civil and detector construction are progressing. Data taking will begin in summer 2010 with 2 detectors at near site. • Full experiment will start taking data in 2011.
The Daya Bay Collaboration Europe (3) (9) JINR, Dubna, Russia Kurchatov Institute, Russia Charles University, Czech Republic North America (14)(73) BNL, Caltech, George Mason Univ., LBNL, Iowa state Univ. Illinois Inst. Tech., Princeton, RPI, UC-Berkeley, UCLA, Univ. of Houston, Univ. of Wisconsin, Virginia Tech., Univ. of Illinois-Urbana-Champaign Asia (18) (125) IHEP, Beijing Normal Univ., Chengdu Univ. of Sci. and Tech., CGNPG, CIAE, Dongguan Polytech. Univ., Nanjing Univ.,Nankai Univ., Shandong Univ., Shenzhen Univ., Tsinghua Univ., USTC, Zhongshan Univ., Hong Kong Univ., Chinese Hong Kong Univ., National Taiwan Univ., National Chiao Tung Univ., National United Univ. ~ 210 collaborators Thank You
Background Summary (a) (d) (c) (b) (1%)
Detector-related systematic uncertainties Relative measurement Absolute measurement Ref: Daya Bay TDR
Experimental sensitivity calculation • Scan in Dm2 – Sin22q13 • Minimize c2 at each point
Global fit to to sin22θ13 [ P. Huber, et al., arXiv: 0907.1896 ]