Download
1 / 59
590 likes | 592 Views
Get the latest updates on tropical SSTs, ENSO conditions, drought, and selected weather/climate events. Also, check out the outlooks for November, NDJ 2014-15, and MDO.

E N D
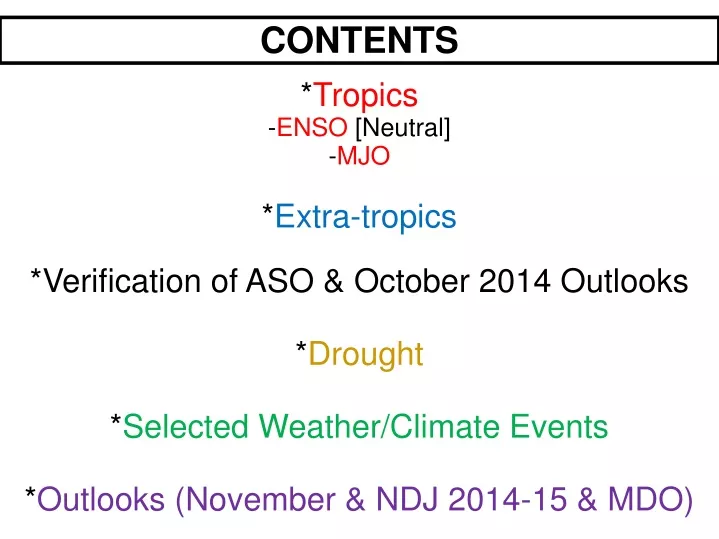
CONTENTS *Tropics -ENSO [Neutral] -MJO *Extra-tropics *Verification of ASO & October 2014 Outlooks *Drought *Selected Weather/Climate Events *Outlooks (November & NDJ 2014-15 & MDO)
The latest weekly SST departures are: Niño 4 0.8ºC Niño 3.4 0.6ºC Niño 3 0.9ºC Niño 1+2 0.6ºC Niño Region SST Departures (oC) Recent Evolution
During the last four weeks, equatorial SSTs were above-average across the Pacific and western Indian Ocean and below-average north of Australia (the Maritime Continent). Global SST Departures (oC) During the Last Four Weeks
During the last four weeks, positive changes in equatorial SST anomalies are evident in small regions of the central and eastern Pacific. Change in Weekly SST Departures over the Last Four Weeks
Subsurface temperature anomalies strongly increased during January - March 2014. During April-July 2014, the positive anomalies decreased to near zero. Temperature anomalies increased between late July and late August, before leveling off. Central and Eastern Pacific Upper-Ocean (0-300 m)Weekly Average Temperature Anomalies
Since early September, positive subsurface temperature anomalies have stretched across most of the equatorial Pacific. Most recent pentad analysis Recently, positive subsurface anomalies in the central Pacific appear to be expanding eastward. Sub-Surface Temperature Departures in the Equatorial Pacific
Updated: 9 October 2014 The chance of El Niño is near 60-65% during the Northern Hemisphere fall and winter. CPC/IRI Probabilistic ENSO Outlook
Most models favor El Niño (greater than or equal to +0.5ºC) to develop during October-December 2014 and persist through Northern Hemisphere spring 2015. IRI/CPC Pacific Niño 3.4 SST Model Outlook Figure provided by the International Research Institute (IRI) for Climate and Society (updated 16 October 2014).
Summary ENSO Alert System Status: El Niño Watch ENSO-neutral conditions continue.* Positive equatorial sea surface temperature (SST) anomalies continue across most of the Pacific Ocean. El Niño is favored to begin in the next 1-2 months and last into the Northern Hemisphere spring 2015.* * Note: These statements are updated once a month in association with the ENSO Diagnostics Discussion, which can be found by clicking here.
Ensemble GFS (GEFS) MJO Forecast Yellow Lines – 20 Individual Members Green Line – Ensemble Mean RMM1 and RMM2 values for the most recent 40 days and forecasts from the ensemble Global Forecast System (GEFS) for the next 15 days light gray shading: 90% of forecasts dark gray shading: 50% of forecasts The ensemble GFS forecast indicates no robust MJO activity during the upcoming week, with a potential emerging signal over the Western Hemisphere and Africa during Week-2.
Temperature Forecast Heidke Skill Scores :Non-Equal Chance(non EC) forecasts: 25.61 All forecasts: 13.58 % coverage not Equal Chance forecasts : 53.02
Precipitation Forecast Heidke Skill Scores :Non-Equal Chance(non EC) forecasts: 33.77 All forecasts: 11.21 % coverage not Equal Chance forecasts : 33.19
Temperature Forecast Heidke Skill Scores :Non-Equal Chance(non EC) forecasts: 39.75 All forecasts: 20.91 % coverage not Equal Chance forecasts : 52.59 • Temperature Revised Forecast Heidke Skill Scores :Non-Equal Chance(non EC) forecasts: 51.09 All forecasts: 30.39 % coverage not Equal Chance forecasts : 59.48
Precipitation Forecast Heidke Skill Scores :Non-Equal Chance(non EC) forecasts: -23.75 All forecasts: -8.19 % coverage not Equal Chance forecasts : 34.48 • Precipitation Revised Forecast Heidke Skill Scores :Non-Equal Chance(non EC) forecasts: 7.83 All forecasts: 2.80 % coverage not Equal Chance forecasts : 35.78
Climate Change • Ten Hottest Years on Record, 1880-2013 • Year Average Global Temperature (Degrees F) • ________________________________________ • 58.41 • 58.39 • 58.33 • 58.32 • 58.32 • 58.30 • 58.30 • 58.28 • 58.28 • 58.24 • Source: Compiled by Earth Policy Institute from National Aeronautics and Space Admin.Goddard Institute for Space Studies
Climate Change (more fun facts) • Oct 2014 tied with Oct 2012 as Warmest Oct on Satellite Record • 38th consecutive Oct above normal • 355st consecutive months with global • temperatures above 20th Century Average • Last Below Average Oct occurred in 1976 • Last Below Average month: Feb 1985 • Last Below Average Year: 1976 • Jan-Oct 2014 warmest on record