Download
1 / 13
130 likes | 215 Views
Modeling Radon in Pennsylvania Mike Huber MAA Session on Quantitative Reasoning and the Environment. Agenda. Why study Radon? How can we get actual data? The Project Discovering Trends Assessment References / Questions. Why Study Radon?.

E N D
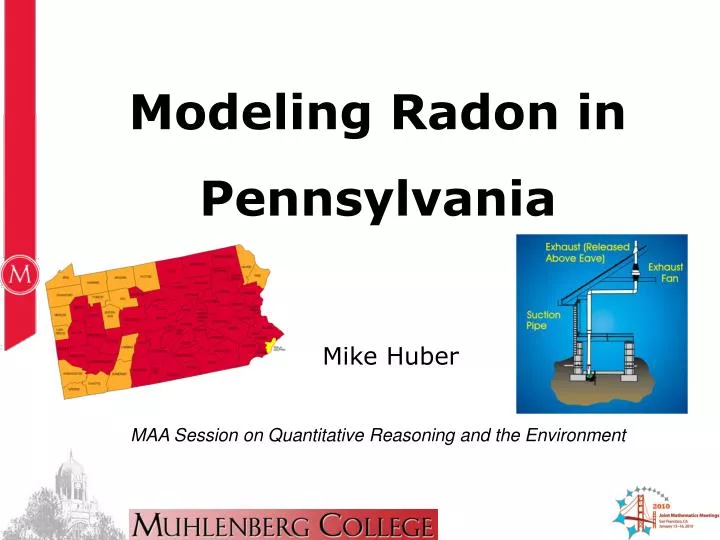
Modeling Radon in Pennsylvania Mike Huber MAA Session on Quantitative Reasoning and the Environment
Agenda Why study Radon? How can we get actual data? The Project Discovering Trends Assessment References / Questions
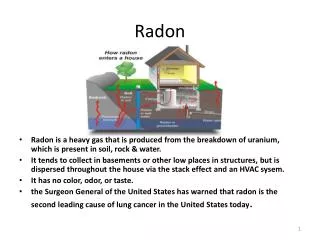
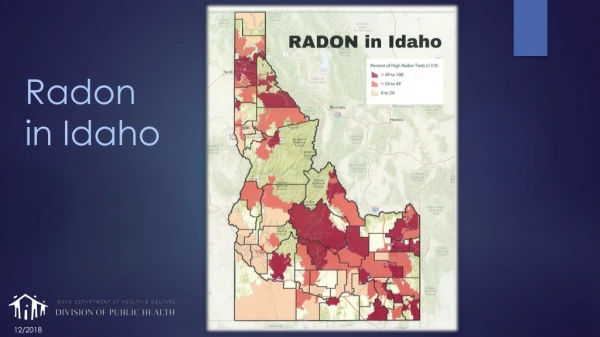
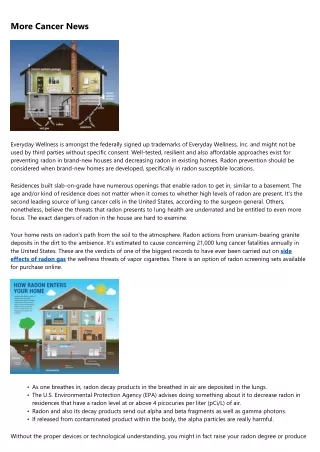
Why Study Radon? Radon is a serious issue in Lehigh County, Pennsylvania. The Environmental Protection Agency has established guidelines and safe levels for residents in the county. Any reading greater than 4 pCi/l (pico Curies per liter) is potentially dangerous. Long-term exposure to radon can lead to lung cancer.
The Project Download the data set for your area (Allentown, Whitehall or Upper Macungie). The data set contains reading of homes tested by the EPA in 2000 in the Allentown area. Each radon reading is given by its location in a latitude/longitude format. Develop a model to predict radon levels in the Allentown area. Predict each level first as a function of latitude and then as a function of longitude. Using a linear regression model, develop a linear model to predict the radon level at the center of each area. The centers are located at: Allentown Lat 40.61N Lon -75.49W Whitehall Lat 40.36N Lon -75.99W Upper Macungie Lat 40.58N Lon -75.66W How confident are you in the models? Do you notice any trends in the data? What cautions might you give a resident who is concerned about radon levels?
The EPA Website www.dep.state.pa.us/RadiationProtection_Apps/Radon
Data for Students ***From PA EPA Bureau of Radiation Protection
Finding a Trend Gather data for the following cities: Tamaqua 18252 Scranton 18510 East Stroudsburg 18301 Emmaus 18049 Easton 18040 Bethlehem 18018 Nazareth 18064 Reading 18640 Jim Thorpe 18229 Quakertown 18951 ***From Google Maps (Terrain)
Assessment Part I: Developing a Model Predicting radon levels (latitude, longitude) Using linear regression Confidence and trends Cautions to resident Comments Part II: Comparing to other zip codes Discussing trends Creating a better model Influential factors Comments Learning Assessment Thread ____ Needs Improvement Satisfactory Excellent Mathematical Reasoning 1 2 3 4 5 Mathematical Modeling 1 2 3 4 5 Scientific Computing 1 2 3 4 5 Communicating Mathematics 1 2 3 4 5
References / Questions • http://www.homeprocanada.ca/radon/radon_450x397.jpg • http://www.dep.state.pa.us/RadiationProtection_Apps/Radon • http://www.nationalsafety.biz/radon/images/zonemap2.jpg • “The Pennsylvania Radon Story,” found online at http:// www.dep.state.pa.us/brp/Radon_Division/PA_Radon_Story1.htm • Conversations with Robert Lewis, Radon Division, Pennsylvania EPA, Bureau of Radiation protection, 2008.