Download
1 / 25
250 likes | 253 Views
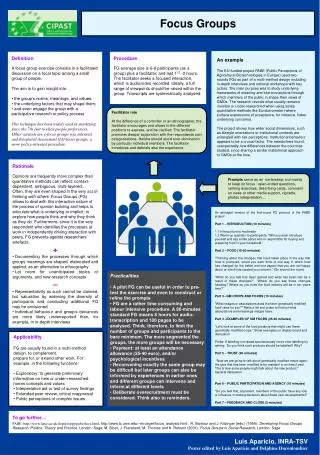
Focus Groups. Collecting the data. Focus group or group interview?. Group interview. Focus group. Researcher facilitates but pathway may diverge Responses often more extreme, personal, provocative, risky Often include activities etc. to prompt discussion

E N D
Focus Groups Collecting the data
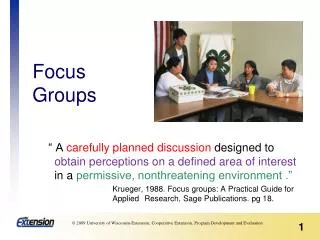
Focus group or group interview? Group interview Focus group Researcher facilitates but pathway may diverge Responses often more extreme, personal, provocative, risky Often include activities etc. to prompt discussion Can include artefact and group dynamics as product, as well as words • Researcher steers in desired direction • Interviewees may aim to provide ‘appropriate’ or ‘helpful’ answers • Questions are the usual starting point • Words (and silences) are the product
Why use focus groups? • Explores issues from participants’ perspectives with researcher’s presence minimised – may thus mitigate ‘courtesy bias’ towards interviewer • Unusual as a socially oriented research procedure (Krueger 1994) • Group dynamics can result in synergy, snowballing, stimulation, spontaneity within a secure setting (Hess 1968) and may thus galvanise group into further action
Why be wary of focus groups? • Dominant characters may take over • A group is more ‘risk taking’ than an individual Does this make the data from such discussion more or less credible? • Data generated may be ‘messy’ and awkward to capture and analyse • Researcher’s role to facilitate, not to control. Researcher has to be a risk taker too … Are you?
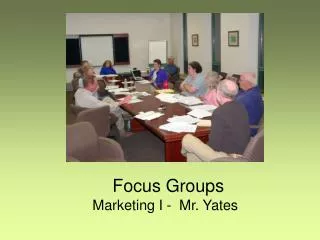
Who to involve in a focus group? • Group of similar age/stage/inclination or structured groups with different roles? • People who know each other, or people who have little contact with each other outside the focus group? • One meeting or several? • Optimal size of group? Do absences matter? Would a virtual group work as well?
How do you facilitate a focus group? Establish ground rules covering purpose, respect, confidentiality and use of data Then use a funnel approach to questioning: • Enable a positive, productive discussion • Elicit key issues • Probe perspectives • Urge group to frame a conclusion Draw on teaching and coaching skills
Sortthese statements to reflect your school practice– give examples • Our strategic planning for school improvement is to develop cultures, policies and practices that include all learners. • We aim to model inclusion in all our staffing policies, relationships with parents/carers and the community. • We will always strive to eliminate prejudice and discrimination against learners with special educational needs. • All learners have a common entitlement to be fully included in all aspects of school life. • We readily provide alternatives to paper and pencil recording where appropriate. • We hold regular disability, equality and inclusion training for staff across the school
Ishikawa ‘fishbones’ diagram Causes Information Attitudes Organisation Effect Improved participation of EAL learners
Focus Groups analysing the data
Quantitative If you can count it, you can graph it! E.g. The group’s actions – who spoke & how? An interpretation of the artefact – how many …? How often was … mentioned? Explore different presentation styles
Graphing interaction within the groupWhat might you want to count?
Analysing poster presentationsAlthough numerical, this ‘count’ is highly interpretive
‘Wordle’ presentation of key wordsBeware emphasis on area rather than length
Qualitative interpretations Visit and revisit the data to extract meanings – an iterative process … Try ‘tagging’ the data with codes Revisiting data Splitting and shedding codes as required
Constant Comparisonbut which comes first? Anomalies, ambiguities challenge model: potential reformulation Data themes & construct categories model Corroborative, illustrative data: refine detail and finesse model
Data -> Codes ->Network model Thomas (2009: 201) analysis of TA discussions generating categories and networks
Conversation analysisa layered approach, deepening analysis of interactions Explication Explanation Exploration • Language and text analysis reading the lines – what is there • Process analysis: deconstruction/detection reading between the lines - how it works • Social & cultural analysis reading beyond the lines- why it works
Social dynamic quantitative analysis Conversation analysis Model developed from reading policy Triangulationbringing sources and analysis together
Presenting the findings Consider: • Charts, tables, lists, mind maps … emphasis on displaying analytical tools within a report • Substantial quotes juxtaposed with lucid interpretation • Selective quotations illuminating an evaluative argument • Synthesised into a coherent piece of creative writing e.g. a play with different endings Telling? Truthful? Triangulated?
And don’t forget the researcher’s tale Your metacognitive journey • Situating the research enterprise • Rationalising the decisions • Articulating the nuances • Embracing the ambiguities • Reflecting growing insight into the process of researching practice
References & Further Reading Barbour, R. & Kitzinger, J. (eds) (1999) Developing Focus Group Research: politics, research and practice. London: Sage. Hess, J.M. (1968) Group interviewing in R.L.Ring (ed.) New Science of Planning. Chicago: American Marketing Association Krueger, R. A. (1994) Focus Groups: a practical guide for applied research. Litosseliti, L. (2003) Using Focus Groups in Research. London: Continuum. Thomas, G. (2009) How do to your Research Project. London: Sage. Wilkinson, D. & Birmingham, P. (2003) Using Research Instruments . London: Taylor Francis