Download
1 / 52
530 likes | 608 Views
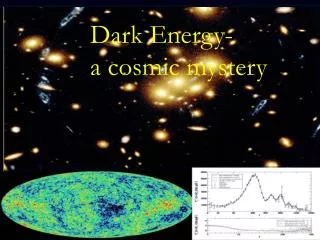
Anomalous Cosmic Rays: Where D o They Come From?. J. R. Jokipii University of Arizona I acknowledge helpful discussions with my colleagues J. K ό ta and J. Giacalone. Presented at the Purple Mountain Observatory, October 10, 2013. TexPoint fonts used in EMF.

E N D
Anomalous Cosmic Rays: Where Do They Come From? J. R. Jokipii University of Arizona I acknowledge helpful discussions with my colleagues J. Kόta and J. Giacalone Presented at the Purple Mountain Observatory, October 10, 2013 TexPoint fonts used in EMF. Read the TexPoint manual before you delete this box.: AAAA
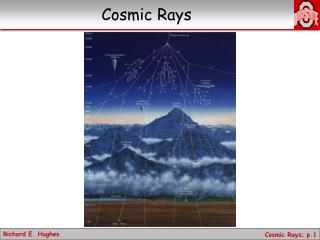
Anomalous cosmic rays begin as interstellar neutral atoms flowing into the heliosphere. They are ionized, either by solar UV or by charge exchange with solar-wind particles. The newly ionized particles are transported out to the outer heliosphere by the solar wind. They are accelerated to several hundred MeV energies and can come back into the inner heliosphere.
For nearly 2 decades, acceleration at the termination shock was the paradigm. However, when Voyager 1 crossed the termination shock in 2005, the observations did not support the simple models of shock acceleration. In response, reconnection and various statistical mechanisms were proposed. They all have acceleration of ACR occurring far out in the heliosheath. I will concentrate on this issue in this talk.
First, any acceleration mechanism must satisfy observational constraints on the acceleration time. The observed ACR charge states limit the acceleration time of ACR to less than about 1 year (e.g., Adams, 1991; Jokipii, 1992; Mewaldt, etal, 1996). Otherwise, interactions with interstellar neutrals would strip them further.
For Nearly-isotropic Distributions The Parker Transport Equation Applies. ) Diffusion ) Convection w. plasma ) Grad & Curvature Drift ) Energy change ) Source Where the drift velocity Vd due to the large scale curvature and gradient of the average magnetic field is: Where L is the length scale of the magnetic field.
Spatial Constraints • Size makes a difference. Larger systems usually can accelerate particles to higher energies. • In quasi-static flows such as perpendicular shocks and reconnection events, the electric potential q E L can be relevant and this depends on the spatial scale L. • Statistical acceleration is not constrained by the electric potential, but, as pointed out, below, the acceleration is generally slow. I is difficult or impossible to meet time constraints. • Statistical acceleration is not constrained by the spatial scale, but is quite slow.
Stochastic vs Deterministic Acceleration • Stochastic acceleration • Example: 2nd-order Fermi • Involves a random walk or diffusion in energy. • Deterministic acceleration • Examples: Diffusive shock acceleration; compression acceleration. • Usually is uni-directional in energy – sometimes involves a directed electric field. • Involves a compression in the magnetic field, so energy change rate is first order in U/w.
First Consider Stochastic Acceleration • Has appeared in various forms since Fermi’s famous paper on 2nd-order Fermi acceleration by randomly moving magnetic clouds. • The acceleration time may be written, quite generally, as where scat is the time for magnetic scattering and Va is the Alfven speed. • The lowest value of stis clearly when scat = gyro , the particle cyclotron period. • This is generally very slow. Applying these considerations to the heliosheath and ACR yields st 200 yr, which is much too long. • Let us look at this in a bit more detail.
Consider acceleration by Compressions, as Suggested by Fisk and Gloeckler • Suppose they have a spatial scale L and amplitude U and oscillate relatively slowly L2/ << compression time scale. • dT/dt = +/- (U/L) ( U , compression/expansion). • t = L2/ (diffusion) or L/vD (drift). • If particles are diffusive, the loss depends on whether compressions are quasi-perpendicular or quasi-parallel. • If compressions are quasi-parallel, use par > wrc/3, and we retrieve the previous result. • If compressions are quasi-perp, loss is determined by VD w rc/L and we again retrieve the previous result.
Deterministic Acceleration: The Role of Electrostatic Potential Energy • In an MHD fluid, the electric field E = -U x B/c is specified by the flow velocity and magnetic field. • In approximately steady flows such as in quasi-perpendicular shocks and reconnection, the maximum energy is just Tmax q Edl q qUBL/c, where is the electrostatic potential. • Example: using this in the latitudinal direction in the heliosphere, integrating from 0 to /2, at any fixed radius R in the solar wind in theTmax 300 ZMeV. • Applying this to the heliospheric termination shock then readily yields the 200 MeV/charge anomalous cosmic-ray (ACR) energy. The termination shock can readily give us the ACR.
Consider Reconnection:Reconnection is a familiar paradigm. Reconnection is often associated with the acceleration of energetic particles. But, does the acceleration occur directly at the reconnection site, or indirectly, through reconnection-associated shocks or turbulence? This is difficult to resolve.
Papers by Lazarian and Opher, 2009, and Drake, et al, 2009 have proposed acceleration at reconnection events in the heliosheath, based on 2-dimensional MHD simulations. • The electric field E = -U x B/c is normal to the frame of the simulation. |U| is about the Alfvén speed in the heliosheath, which is significantly less than the solar wind speed. Hence the electric field is significantly smaller. • Hence this acceleration is limited to much-lower energies than shock acceleration.
General Considerations Regarding Acceleration in Reconnection • In both Lazarian and Opher and Drake, et al., the energy change comes from drift in the ambient electric field. • This electric field E = -U x B/c is normal to the frame of the simulation. |U| is about the Alfvén speed in the heliosheath, which is significantly less than the solar wind speed. • Hence, even if the scale of the reconnection event is the scale of the heliosphere, for this mode of acceleration, a single reconnection event in the heliospherecannot yield the 200 MeV/charge ACR. One must postulate multiple events. • Moreover, there is a much-more-fundamental issue with reconnection as a particle accelerator.
As pointed out earlier, for a nearly-isotropic particle angular distribution, the particle energy change dT/dtU. • The reconnection models all are incompressible, so U = 0. • Hence, we must either establish that there are large anisotropies generated in the models of Drake or Lazarian or we must consider higher-order terms in the transport equation (go beyond Parker). • In what follows, I will do the latter, and leave the large anisotropy issue to a later time.
Reconnection models or simulations are often associated with shocks and turbulence, which are known to accelerate charged particles. The acceleration of charged particles at the reconnection itself is not as well-established.
Recent papers on acceleration in reconnection events. Drake, et al, 2009 had a different proposal which also involved reconnection in multiple heliospheric sites: Lazarian and Opher (2009) proposed turbulent reconnection in the heliosheath, with multiple Sweet-Parker reconnection regions.
Drake, et al, 2006, discussed a way to accelerate electrons. Multiple reconnection sites result in closed magnetic islands. As these islands change in time, they accelerate the electrons.
Consider charged-particle acceleration at reconnection in the general configuration used by Sweet and Parker in their original papers in the middle of the 20th century. The Quasi-Static Sweet-Parker Picture In this generic figure, the black arrows are flow velocity, blue lines are the magnetic field. U= 0. To get acceleration, we must go beyond the Parker equation.
An Extension of Parker’s Transport Equation. • Earl, Jokipii and Morfill (1988) published an extension of Parker’s transport equation, in which acceleration of charged particles was demonstrated, even if U = 0. Note: in index notation U = Ui/xi. • The acceleration is due to fluid shear and acceleration. • The extended equation for f0 (xi,p,t) as a function of position xi, momentum p and time t may be written for the case of no mean magnetic field (a finite magnetic field is similar, but more complicatate): where is the scattering time and the viscous and acceleration terms are:
An Extension of Parker’s Transport Equation. • Earl, Jokipii and Morfill (1988) published an extension of Parker’s transport equation, in which acceleration of charged particles was demonstrated, even if U = 0. Note: in index notation U = Ui/xi. • The acceleration is due to fluid shear and acceleration. • The extended equation for f0 (xi,p,t) as a function of position xi, momentum p and time t may be written for the case of no mean magnetic field (a finite magnetic field is similar, but more complicatate): Parker new terms where is the scattering time and the viscous and acceleration terms are:
A cartoon illustration of the two new terms. • The scattering conserves the particle energy in the frame moving with the particle. • But the fluid frame at the particle can change between the scatterings, even if U = 0. • Hence, the particle energy (in the fluid frame) changes in the scattering. This change can be either positive or negative. • The large-scale electric field does NOT cause the energy change.
Analysis of the Extended Particle-Transport Equation • The equation shows energy change, even if U = 0. • The additional energy-change terms involve the velocity shear () and fluid acceleration (Ai) terms. • The new terms are of 2nd order in the fluid velocity compared to the particle speed w and hence the acceleration can be slow if U/w << 1. • Nonetheless, this has not been discussed before, so I will summarize a result not yet published.
A simple, illustrative fluid velocity may be used in the stochastic solutions for the particle acceleration. Contours of Flow Velocity Magnitude The magnetic field may also be determined in quadratures for the assumed velocities, although B is not required in order to determine the acceleration. Magnetic Field U Contour plot of the associated acceleration rate U
Heliosheath numbers • In the inner heliosheath, there is little or no adiabatic cooling. The constraint is the acceleration time < few years. • Again • Using U ~ Va ~106, we obtain L < .1 AU, for the scale of the reconnection region. • This seems to be not unreasonable, but quite small.
Most Important:Observations strongly suggest that reconnection does not accelerate particles. Absence of energetic particle effects associated with magnetic reconnection exhausts in the solar wind • J. T. Gosling1, R. M. Skoug1, D. K. Haggerty2, D. J. McComas3 • Article first published online: 30 JUL 2005 • DOI: 10.1029/2005GL023357 Abstract We have examined energetic particle data (>38 keV for electrons and >47 keV for protons) obtained in intervals surrounding a set of 7 encounters with Petschek-type reconnection exhausts in the solar wind by the Advanced Composition Explorer. We find no evidence for any substantial increases in energetic particle intensity associated with those encounters. This indicates that local reconnection is not a significant source of energetic particles in the solar wind and suggests the possibility that reconnection itself may not be a particularly effective process for populating other space and astrophysical environments with energetic particles.
Back to Diffusive Shock Acceleration • Diffusive shock acceleration has had a poor press recently because of the Voyager 1 observations. • I will here go through some of the constraints and demonstrate that diffusive shock acceleration works.
The general result from applying the Parker equation to a shock (diffusive shock acceleration). Acceleration about a year for ACR at the termination shock
The solar-wind termination shock is essentially a perpendicular shock. Hence the energy gain comes from drift in the -U x B/c electric field. The change in electric potential between the pole and the equator is 300 Z MeV Hence this this can readily provide the 200 MeV kinetic energy.
Illustrative ACR model results and data, showing the ‘unfolding’ of the energy spectrum with increasing radius inside the shock and decreasing intensity beyond.
However, when Voyager 1 crossed the termination shock, the observations were quite puzzling. The intensity did not peak at the shock. Immediately, reconnection and compressions were put forward to explain this. We have looked at these models. These models had the acceleration occurring far out in the heliosheath.
However, There is Forgotten Evidence Regarding the Location of the ACR Source • In 2000, McDonald et al published V1 data concerning the recovery of GCR and ACR from the passage of a disturbance (MIR?) at ~ 42 AU. • The recovery of the GCR took much longer than that of the ACR. • Their interpretation was that the source region of the ACR was at the termination shock, near 90 AU, and the GCR were coming from outside of the heliopause, much further out. This was written when it was still thought that the termination shock accelerated the ACR. • However, another way of stating it is that the source of the ACR is in the inner heliosheath, consistent with a termination-shock origin.
Left, observations reported by McDonald, et al, 2000, which strongly argue for the source of ACR being located at or near the termination shock. The cartoon at right illustrates the effects of a disturbance on the ACR and GCR.
A simple model which shows that the source (accelerator?) of the ACR must be well-inside of the GCR source.
These observations strongly imply that the source (accelerator?) of the ACR must be well-inside of the GCR source, near the termination shock. This would appear to rule out the published non-shock models.
Left, the result of computer simulation of a 2-dimensionalblunt heliosphere, with a propagating disturbance, including ACR acceleration at the termination shock. Note the similarities with the observations at right. Also see Jokipii-Kota poster at this meeting. Note: the parameters have not been optimized.
Can Diffusive Shock Acceleration at the Termination Shock Account for the Acceleration? • The V1 and V2 observations at the shock showed a blunt, turbulent termination shock. • Acceleration at a blunt termination shock shows the same general behavior as shown in the observations (McComas & Schwadron, Kota and Jokipii. • A turbulent shock does the same (Kota and Jokipii, Guo and Jokipii). • Possibly, both effects are taking place to affect the acceleration of the ACR.
Consider a blunt termination shock. This is the McComas-Schwadroncartoon model.
Kota model (also McComas and Schwadron) with a blunt termination shock. The results are similar to the hot-spot model. The physics is quite similar.
Solar-wind turbulence will produce a spatilly varying shock, producing localized ‘hot spots’. Schematic Illustration of localized, possibly time-dependent acceleration “hot spot” at the termination shock.
Guo-Jokipii (2010) considered a varying B. Below is a comparison of their results with LECP data (provided by Rob Decker). A blunt heliosphere would produce similar results.
Results from a recent paper by Fan Guo and me, showing the effects of a varying Magnetic field at a quasi-perpendicular shock. Note the ‘hot spots’.
With hot spots, having all energies peaking at or near the shock is quite unlikely.
Compare Guo-Jokipii with LECP data (from data provided by Rob Decker)
Compare the observations with asimple global model. ) Free Access ACR acceleration ) Escape Boundary )