Download
1 / 38
380 likes | 457 Views
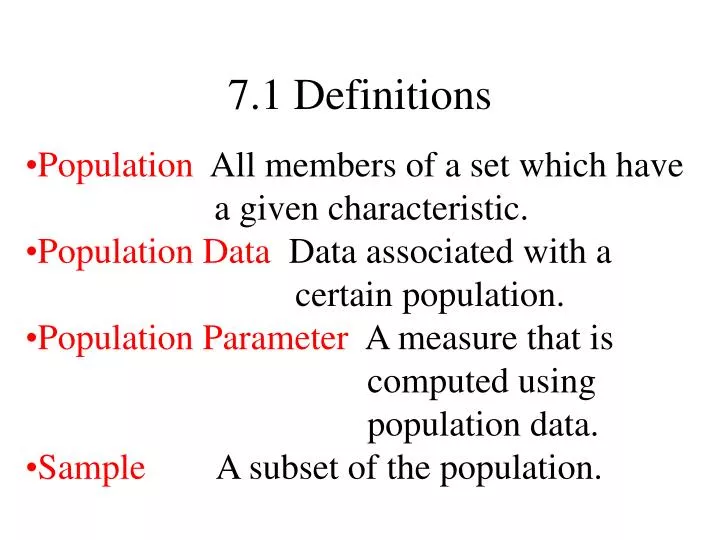
7.1 Definitions. Population All members of a set which have a given characteristic. Population Data Data associated with a certain population. Population Parameter A measure that is

E N D
7.1 Definitions • Population All members of a set which have • a given characteristic. • Population Data Data associated with a • certain population. • Population Parameter A measure that is • computed using • population data. • Sample A subset of the population.
Statistic An estimated population parameter • computed from the data in the • sample. • Random Sample A sample of which every • member of the population • has an equal chance of • being a part. • Bias A study that favors certain outcomes. • Point Estimate A single number (point) that • attempts to estimate an • unknown parameter.
Sample number 1 Population (Size of population = N) Sample number 2 Sample number 3 Sample number NCn Each sample size = n
med 6 10 11 P(x) .3 .4 .3 Example: Let N = {2,6,10,11,21} Find µ, median and σ µ = 10 median = 10 σ = 6.36 How many samples of size 3 are possible? 5C3 = 10
Sample Population Sample Population Point Estimators
Random Number Table 1 092725 012157 827052 297980 625608 9641342 104460 007903 484595 868313 274221 3671813 676071 388003 266711 323324 044463 7628034 881878 862385 203886 261061 096674 8115485 534500 336348 086585 241740 581286 0084356 094276 615776 242112 985859 075388 0820037 333848 513630 474798 841425 331001 5427408 847886 629263 596457 589243 576797 8009579 942495 695172 523982 264961 771016 11879710 450553 679145 324036 715835 963418 53304811 024670 615375 717260 171144 340939 20871212 932959 205554 113225 704406 263818 633643
Definition: The sampling distribution of the X’s is a frequency curve, or histogram constructed from all the NCn possible values of X. Characteristic 1. The mean of all the NCn possible values of X is equal to the population mean, µ. Characteristic 2. The standard deviation of the sampling distribution which is the standard deviation of all the NCn of X is equal to the standard deviation of the population divided by the square root of the sample size. (Also called the standard error, SE.) Characteristics of a Sampling Distribution
Assumptions Large Samples • n > 30 The sample must have more than 30 values. • Simple Random Sample All samples of the same size have an equal chance of being selected.
Definitions • Estimator a formula or process for using sample data to estimate a population parameter • Estimate a specific value or range of values used to approximate some population parameter • Point Estimate a single value (or point) used to approximate a population parameter
Definitions The sample mean x is the best point estimate of the population mean µ. The sample standard deviation s is the best point estimate of the population standard deviation . The sample proportion p is the best point estimate of the population proportion .
Central Limit Theorem Under certain conditions, the sampling distribution of the X’s result in a normal distribution Confidence Interval (or Interval Estimate) A C% confidence interval for a population mean, μ, is an interval [a,b] such that μ would lie within C% of such intervals if repeated samples of the same size were formed and interval estimates made.
Definition Confidence Interval (or Interval Estimate) a range (or an interval) of values used to estimate the true value of the population parameter Lower # <population parameter < Upper #
Confidence Interval (or Interval Estimate) a range (or an interval) of values used to estimate the true value of the population parameter Lower # <population parameter < Upper # As an example Lower # << Upper #
Degree of Confidence • (level of confidence or confidence coefficient) the probability 1 - (often expressed as the equivalent percentage value) that is the relative frequency of times the confidence interval actually does contain the population parameter, assuming that the estimation process is repeated a large number of times usually 90%, 95%, or 99% ( = 10%), ( = 5%), ( = 1%)
Interpreting a Confidence Interval 98.08o <µ < 98.32o Correct:We are 95% confident that the interval from 98.08 to 98.32 actually does contain the true value of . This means that if we were to select many different samples of size 106 and construct the confidence intervals, 95% of them would actually contain the value of the population mean . Wrong:There is a 95% chance that the true value of will fall between 98.08 and 98.32.
Critical Value the number on the borderline separating sample statistics that are likely to occur from those that are unlikely to occur. The number z/2is a critical value that is a zscore with the property that it separates an area /2in the right tail of the standard normal distribution.
z2 The Critical Value 2 2 z2 -z2 z=0 Found from Table A-2 (corresponds to area of 0.5 - 2 )
Finding z2for 95% Degree of Confidence 95% = 5% 2 = 2.5% = .025 .95 .025 .025 z2 -z2
Finding z2for 95% Degree of Confidence 95% = 5% 2 = 2.5% = .025 .95 .025 .025 z2 -z2 Critical Values
Finding z2for 95% Degree of Confidence = 0.05 = 0.025 .4750 .025 Use Table A-2 to find a z score of 1.96
Finding z2for 95% Degree of Confidence = 0.05 = 0.025 .4750 .025 Use Table A-2 to find a z score of 1.96 z2 = 1.96 .025 .025 - 1.96 1.96
Definition Margin of Error
Definition is the maximum likely difference observed between sample mean x and true population mean µ. denoted by E Margin of Error
x - E Definition is the maximum likely difference observed between sample mean x and true population mean µ. denoted by E Margin of Error µ x + E
x - E Definition is the maximum likely difference observed between sample mean x and true population mean µ. denoted by E Margin of Error µ x + E x -E < µ < x +E
x - E Definition is the maximum likely difference observed between sample mean x and true population mean µ. denoted by E Margin of Error µ x + E x -E < µ < x +E upper limit lower limit
E = z/2 • n x - E Definition Margin of Error µ x + E
E = z/2 • n x - E Definition Margin of Error µ x + E also called the maximum error of the estimate
Calculating E When Is Unknown • If n> 30, we can replace in Formula 6-1 by the sample standard deviation s. • If n 30, the population must have a normal distribution and we must know to use Formula 6-1.
x - E < µ < x + E µ = x + E (x + E, x - E) Confidence Interval (or Interval Estimate) for Population Mean µ(Based on Large Samples: n >30)
Procedure for Constructing a Confidence Interval for µ( Based on a Large Sample: n > 30 ) 1. Find the critical value z2 that corresponds to the desired degree of confidence. 2. Evaluate the margin of error E = z2 • / n . If the population standard deviation is unknown, use the value of the sample standard deviation s provided that n > 30. 3. Find the values of x - E and x + E. Substitute those values in the general format of the confidence x - E < µ < x + E interval: 4. Round using the confidence intervals roundoff rules.
Example: A study found the body temperatures of 106 healthy adults. The sample mean was 98.2 degrees and the sample standard deviation was 0.62 degrees. Find the margin of error E and the 95% confidence interval.
E = z/ 2• = 1.96 • 0.62 = 0.12 n 106 Example: A study found the body temperatures of 106 healthy adults. The sample mean was 98.2 degrees and the sample standard deviation was 0.62 degrees. Find the margin of error E and the 95% confidence interval. n = 106 x = 98.20o s = 0.62o = 0.05 /2 = 0.025 z/ 2= 1.96 x - E < < x + E 98.20o - 0.12 <<98.20o + 0.12 98.08o << 98.32o
Example: A study found the body temperatures of 106 healthy adults. The sample mean was 98.2 degrees and the sample standard deviation was 0.62 degrees. Find the margin of error E and the 95% confidence interval. Based on the sample provided, the confidence interval for the population mean is 98.08o<<98.32o. If we were to select many different samples of the same size, 95% of the confidence intervals would actually contain the population mean .
Finding the Point Estimate and E from a Confidence Interval Point estimate of µ: x =(upper confidence interval limit) + (lower confidence interval limit) 2 Margin of Error: E = (upper confidence interval limit) - (lower confidence interval limit) 2