Download
1 / 31
560 likes | 1.36k Views
DMAIC for Inventory Reduction - TAPS. Manoj Ganeshan MS in Reliability and Quality Engineering University of Arizona. Key Words. TAPS - Tata Auto Plastics Systems Indica - Small size car manufactured by Customer FG - Finished Goods RM - Raw material RG / RP - Reground / Re- pelletized

E N D
DMAIC for Inventory Reduction - TAPS Manoj Ganeshan MS in Reliability and Quality Engineering University of Arizona
Key Words • TAPS - Tata Auto Plastics Systems • Indica - Small size car manufactured by Customer • FG - Finished Goods • RM - Raw material • RG / RP - Reground / Re- pelletized • Comp - Components • SP – Supplier parts • WIP - Work in progress • BOM- Bill of Materials
Process Flow Diagram RM ( plastic material) Material stays in Stores SP RG/RP RM(WIP) COMP (WIP) Material as WIP Finished products wait in FG before being dispatched FG
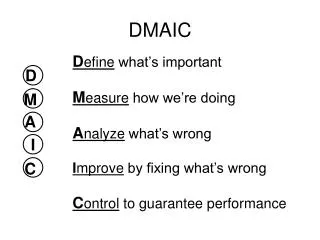
Cost of Poor Quality • Pareto Chart • Process Flowchart • Critical to Matrix (CT) DEFINE • Identify what is important to the customer. • Define Project Scope Y= Number of days of Inventory = Weekly Inventory ($)/ Sales($) per day
DEFINE Problem Statement The Avg inventory was about $ 200 K . No of days of Inventory (Y)---- 12.8 days Industry Benchmark--------- 8 days. Gap to be reduced The initial benchmarking figures are based on data collected in March 01. The actual average sales per day in this time period was $15,931.5 Note
Process to be improved • Inventory Management • Customers VP- Operations VP- Finance • What do the customers care about CTQ ---- Quality of inputs must be good( Customer-Opns) CTC------ Inventory Carrying Cost must be minimum ( Customer- Finance) CTD------ On-Time delivery of material to production( Customer-Opns) • Characteristic should be selected for improvement • Inventory Carrying Cost – CTC.
Improved profitability and cash flow Less Inventory Carrying Cost • Impact to business if the characteristic (s) is/are improved Reduced Inventory • Process Boundaries • Start: Raw Material receipt by the Stores • End: Dispatch of finished goods by through invoice • Deliverables • Reduce Inventory and the Number of days of Inventory (Y) • Collateral Damage No “ Line Stoppage”
Project Scope/ Focus TAPS Mold Shop Paint Shop Safari Fiat Indica Bajaj LTJD FG RM (S) RG/RP (WIP) SP Comp (WIP) RM (WIP)
Process Mapping Check Sheets Pareto Chart Measurement Systems Analysis (MSA) Process Capability Analysis MEASURE • Determine what to measure (Y) and validate the measurement system • Quantify Current performance • Set Improvement Target
Data Collection Inventory classified into 6 groups. ( Stratification of Data) • RM (Stores) • SP • RG/RP • FG • WIP Components • RM (WIP) Selected for Improvement
MSA….Measurement System Analysis • Discrepancies found in Measurement Systems(Computer vs.. Manual) • Deviations rectified- Systematic Sampling done. BEFORE (Data in Kilograms) Feb Data Unsatisfactory AFTER(Data in Kilograms) Mar Data Satisfactory Actions taken for improvement: Educated responsible manufacturing associates for MRP data entry. Took actual daily physical inventory for 2 weeks and analyzed problems faced at various stages of data entry.
C & E Diagram 5-Why Analysis Hypothesis Testing FMEA Multi Vari Charts Correlation and Regression DOE ANALYZE Verify/ Eliminate Causes Explore Data Generate Hypothesis about causes
C & E Diagram for RG / RP Method 2. ) Consumption is less than set norm Poor acceptance Data available Fear of rejection Inconsistency of material performance in the past Contamination of RG-RP No system to control contamination during grinding No awareness Lack of communication Indicates a highly probable cause Lack of clarity No ownership RG / RP
Verification of Cause 2 in RM C&E Diagram TOTAL INDICA RM Actual Inventory Actual Production 16 Feb - 18 Mar BUMPER RM EXAMPLES Actual Inventory Actual Production
Voting Down the List of Causes - RG/RP The team has identified & verified these as the most important causes of the effect.
Setting Improvement Target Actual Inventory Target Category (In Days) (In Days) 2 RM 2.6 1.5 RG/RP 3 SP 3.4 2 FG 2.7 2 WIP 1.1 0.5 Total 12.8 8
DOE Mistake Proofing Statistical Tolerancing FMEA Hypothesis Testing IMPROVE • Determine solutions(ways to counteract causes) including operating levels and tolerances • Install solutions and provide statistical evidence that the solutions work
Improvement Phase Key Causes Countermeasure Key Output Variables Problem statement Stocking Policy per varying customer demand Stocking Policy not dynamic RM / SP Levels Production Planning not synchronised Material purchase aligned with prod. Agreement on use of RP reached RP not factored Inventory High Consumption less than norm Month wise reduction plan documented Another Six Sigma team is addressing this issue RG / RP levels High Rejection Long cycle time Being analysed
Sample 1: Project Planning Worksheet Countermeasure - Stocking Policy, Imported SP 2.) Dynamic stocking policy - Imported SP Duration Start date End date Responsibility a.) Month wise, item wise inventory reduction plan (upto Sept 01) to be prepared. 2 days 18-Apr 20-Apr S. Kolhe b.) Item wise purchase quantities to be worked out 2 week 21-Apr 5-May c.) Monthly call off to be given for all imported items. V. M. Limaye Maintain reserve stocks Continuous 6-May Continuous What needs to be done Who’s going to help do it How Long will it take?
Overall Results... Before 12.8 12 Countermeasure implementation initiated 12.0 Y Axis - Number of Days of Total Inventory 11 10 9 8.9 Target 8 7.95 After 6.7 6.66 7 Apr May June July Aug Mar
RM Results... Days Before 2.6 Y Axis - Number of Days of RM Inventory 2.4 2.2 2.0 Target 2.0 1.95 After 1.8 1.72 1.73 1.69 1.6 Apr May June July Aug Mar
Days RG/RP Results... 4.1 3.5 Before Y Axis - Number of Days of RG/RP Inventory 3.0 3.0 2.82 2.5 After 2.0 2.2 2.2 Target 1.88 1.5 Apr May June July Aug Mar
Days SP Results... Before 3.5 3.4 Y Axis - Number of Days of SP Inventory 3.0 2.5 2.59 Target 2.0 After 2.0 1.5 1.51 1.35 1.04 1.0 Apr May June July Aug Mar
Days FG Results... Before 3.0 Y Axis - Number of Days of FG Inventory 2.72 2.5 2.54 Target 2.0 1.82 1.74 After 1.5 1.55 1.0 0.82 0.5 Aug Apr May June July Mar
Signs of Improvement Synchronization activity started First signs of Improvements Actual Inventory Actual Production 16 Feb - 18 Mar Inference: Attempts should be made to synchronize daily RM purchase with production batch size
Control Plans Control Charts Visual Management Procedures/ Work Instructions Process Capability Total Productive Maintenance (TPM) CONTROL • Put Controls in place to maintain improvement over time • Provide statistical evidence that the improvement is sustained
Control Phase • Our team determined how to keep the best practices (our Xs) in control in order to maintain the improvement in Y over time. • Developed a detailed control plan for Xs( Causes) Y = f (X1, X2, X3, …) Implement a process to control our Xs Continue to sample Y X 1 =Stocking policy not dynamic X 2 =Prod planning not synchronized …..and so on
Control Phase.. • Inventory management process reasonably under control & we are holding gains. • Uncovered a new problem- Quality of product( CTQ) • Must reduce the production of RG material by systematically reducing bumper rejections. • Best inventory practices developed in this project can be leveraged to other projects.
Overall Results Savings ~ 42 % reduction in number of days of Indica Mould Shop Inventory in 6 months (March - August 01) ~ US $ 45,000 reduction in actual working capital with a ~ 45 % increase in sales volume between March and August 01.
Key Project Learnings • DMAIC is an effective strategy for improving processes such as inventory management • Complexities of inventory measurement realized • The importance of cascading / focusing / prioritizing our problem to a manageable level • Estimating project savings in the initial stages is very crucial as it helps clarify team’s & management's expectations from the project. • How to apply C&E diagrams to identify root causes • Concentrating on Causes (Xs), verification through data the big Xs, and systematically improving Y by controlling Xs
Closing Remarks • Our team delivered measurable results & we are holding the gains for the last three months • Success was definitely through team work • Accountability amongst team members was good • This project was data driven • Commitment from management was very good • This project provided indisputable evidence that Six-Sigma works for transactional processes also Lets make Six-Sigma “The Way We Work”