Download
1 / 21
210 likes | 318 Views
Calculating heat stress index from routine weather station data to model climate change impacts on worker productivity. Bruno Lemke , Tord Kjellstrom. Quantifying Climate Change.

E N D
Calculating heat stress index from routine weather station data to model climate change impacts on worker productivity Bruno Lemke, TordKjellstrom
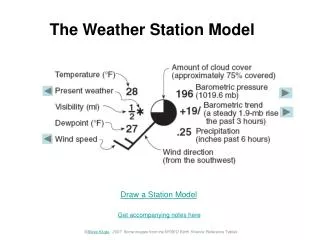
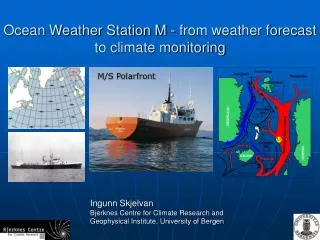
Quantifying Climate Change • Climate change will increase temperatures in most places around the world in the coming decades. Temperatures in urban areas will go even higher due to the “heat island effect”. In order to measure the effect of climate change on worker productivity a heat stress index that incorporates temperature, humidity, wind speed and solar radiation is needed.
What Heat index to use? • Effective Temperature: CET, ET, NET, PET, SET • WBGT: most comprehensively studied • UTCI: for both hot and cold temperatures • ETVO: all components separately identified • Humidex: Canada • HI: USA • Comfort indexes: PMV • Physiological models: PHS, Fialaetc
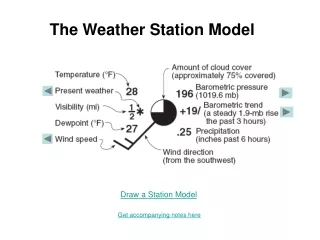
The four environmental variables • You need an index that includes: • Temperature • Humidity • Wind speed • Solar radiation
Plus personal variables • Work rate • Clothing • Degree of acclimatisation • Level of hydration • Heat response sensitivity • Age • Health • Gender • Ethnic group • Body area • Obesity Highly variable
Main contenders for heat index • UTCI: new index with laboratory validation • WBGT: older extensively field tested index • Many other indexes do not include all the climatic variables
WBGT is a physical model • Heat stress is about losing heat mainly by sweating and by wind:
Simple model • Use a thermometer
Simple model • Use a thermometer, add a wet wick
Add radiation= WBGT index • WBGT(indoor) = 0.7Tnwb + 0.3Ta • WBGT(outdoor) = 0.7Tnwb + 0.2Tg + 0.1Ta
Which index would you use? WBGT UTCI
Advantages of WBGT • Easy to measure • A scale that has been around for ages so well tested heat stress standards • Contains all the environmental components without confounding them with personal variations
Issues with WBGT • Does not take into account physiological changes other than sweating. • WBGT not suitable below heat stress levels. • WBGT not useful as such for historical data.
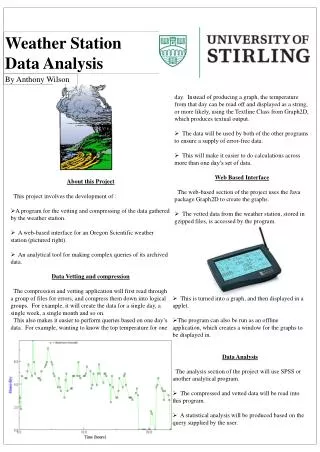
WBGT from meteorological data • We compare published models that generate the WBGT heat stress index from standard hourly weather station data.
WBGT from meteorological data • Same process as working out heat gain/loss by people EXCEPT its less complicated.
WBGT from meteorological data • Some formulas only for indoors (Bernard) • Others are only for full sunlight (Gaspars). • Liljegren: "best formula" for outside conditions (both sun and clouds) • They freely supply a computer program. • Liljegrenet al (2008) “Modeling Wet Bulb Globe Temperature using Standard Meteorological Measurements” Journal of Occupational and Environmental Hygiene 5: 645-655
Continuous work 0-25% 25-50% 50-75% 75-100% no rest rest rest rest work