Download
1 / 16
170 likes | 274 Views
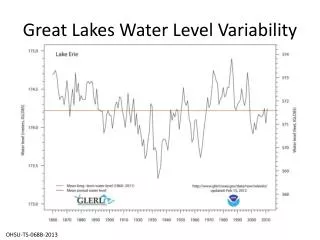
Variability of Denmark Strait Overflow Water. Hendrik M. van Aken & M. Femke de Jong THOR meeting, November 2009, Paris. 2009 survey AR7E. Time series from repeat surveys AR7E. q minima since 1991.

E N D
Variability of Denmark Strait Overflow Water Hendrik M. van Aken & M. Femke de Jong THOR meeting, November 2009, Paris NIOZ is part of the Netherlands Organisation for Scientific Research (NWO)
q minima since 1991 The DSOW in different years lies near isopycnal, s341.67 (±0.02) kg/m3, but with varying q-S combinations. Different DSOW sources?? Two main contrasts!!
All near-bottom observations since 1991, between the ~2500 m isobaths. Transition from DSOW to NEADW.
The LOCO-2 mooring Temporal variation in DSOWs-DSOWf contrast
The LOCO-2 mooring Temporal variation in DSOW density
The LOCO-2 mooring Temporal variation in DSOW density Annual cycle as the dominant periodicity in density??
5 years of high-frequency LOCO-2 observations also show the DSOWs-DSOWf contrast.
LOCO-3 shows the connecting water mass between DSOWs/f and the NEADW, with salinity bimodality.
LOCO-3 follows the DSOWs/f signal of LOCO-2 with a delay of ~1.5 month
But no apparent relation between the density variability at LOCO-2 and LOCO-3 LOCO-2: annual cycle LOCO-3: higher-frequency sloshing in canyon in Reykjanes Ridge?
Near parallel 5-year trends in density are found at both moorings
The 5 year trend at LOCO-2 contrasts the long-term (19 year) trend of DSOW from the AR7E repeat surveys.
Concluding Questions: • What is the cause of the observed DSOWs-DSOWf contrast? Something happening in Denmark Strait? • Why is there an annual signal in the density at LOCO-2; Plume dynamics or meteorology in Denmark Strait? • What causes the long-term trends in density, and do they tell us something about changes in the THC? • Are these signals also found further downstream?