Download
1 / 29
290 likes | 351 Views
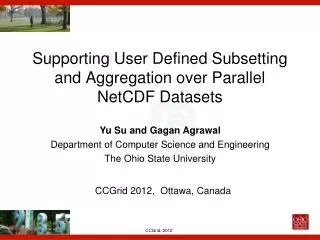
Supporting Correlation Analysis on Scientific Datasets in Parallel and Distributed Settings. Yu Su*, Gagan Agrawal*, Jonathan Woodring # Ayan Biswas*, Han-Wei Shen* *The Ohio State University # Los Alamos National Laboratory. Motivation: Big Data. Molecular Simulation: Molecular Data.

E N D
Supporting Correlation Analysis on Scientific Datasets in Parallel and Distributed Settings Yu Su*, Gagan Agrawal*, Jonathan Woodring# Ayan Biswas*, Han-Wei Shen* *The Ohio State University #Los Alamos National Laboratory
Motivation: Big Data Molecular Simulation: Molecular Data Life Science: DNA Sequencing Data (Microarray) Earth Science: Ocean and Climate Data Space Science: Astronomy Data • Gaps between data generation and storage
Big Data (Volume/Velocity) Challenge • Data Movement is the Bottleneck • Memory to CPU • Disk to Memory • Wide Area • Memory availability is another challenge • Can we work with a summary of data? • Compression approaches already shown applicable
Context: Correlation Data Analysis • Scientific Analysis Type: • Individual Variable Analysis • Data Subsetting, Aggregation, Mining, Visualization • Correlation Analysis • Study relationship among multiple variables • Make interesting scientific discoveries • “Big Data” problem becomes more severe: • Huge data loading cost (multiple variables) • Additional filtering cost for subset-based correlation analysis • Huge correlation calculation cost • Correlation analysis is useful but extremely time consuming and resource costly
Our Solution and Contributions(1) • Identify bitvectors as a summary structure • Space efficient • Data movement efficient • Assume constructed offline • Correlation computation using bitmaps • Better efficiency • Smaller memory cost • Parallelization • Across data stored in distributed repositories
Our Solution and Contributions (2) • An interactive framework to support both individual and correlation analysis based on bitmaps • Correlations and other operations using high-level operators • Individual Analysis: flexible data subsetting • Correlation Analysis: interactive correlation queries among multi-variables • Correlation over flexible data subsets • Combine with index-based sampling
Background: Bitmap Indexing Widely used in scientific data management Suitable for floating value by binning small ranges Run Length Compression(WAH, BBC) Bitmap Indices can be treated as a small profile of the data
Bitmaps and Summarization • Preserves spatial Distribution of data • Accurate within the limits of binning • Storage requirement within 15-25% after compression • Entropy-preserving sampling (HPDC 13) • May already be built to support query processing • How do we calculate correlation metric? • Accurately and Efficiently
Metrics of Correlation Analysis • 2-D Histogram: • Indicate value distribution relationship • Value distribution of one variable regarding to change of another • Shannon’s Entropy: • A metric to show the variability of the dataset • Low entropy => more constant, predictable data • High entropy => more random distributed data • Mutual Information: • A metric for computing the dependence between two variables • Low M => two variables are relatively independent • High M => one variable provides information about another
Bitmap-based Correlations • No Indexing Support: • Load all data of variable A and B • Filter A and B and generate subset (for value-based subsetting) • Generate joint bins: divide A and B into bins, generate (A1, B1)->count11, … (Am, Bm)->countmm by scanning each data element • Calculate correlation metrics based on joint bins • Dynamic Indexing (build Index for each variable): • Query bitvectors for variable A and B (much smaller index loading cost, very small filtering cost) • Generate joint bins: generate (A1, B1)->count11, … (Am, Bm)->countmmbased on fast bitwise operations between A and B (bitvectors# are much smaller than elements#) • Calculate correlation metrics based on joint bins
Calculation Steps Memory
Static Indexing • Dynamic Indexing: • build one index for each variable • Still need to perform bitwise operations to generate joint bins • Static Indexing: • build one index over multi-variables • Only need to perform bitvectors loading and calculation
Parallel Indexing: Dim-based Partitioning • Pros: efficiency parallel index generation • Cons: slave node cannot directly calculate the results. Big reduction overhead
Parallel Indexing: Value-based Partitioning • Pros: partition for parallel index generation is more time-consuming • Cons: slave node can directly calculate partial results. Very small reduction overhead
Correlation Analysis in Distributed Environment Computing Node Without Indexing Support Using Bitmap Indexing Read Data Subset Read IndexSubset
Correlation Analysis over Samples Logic operations between sample of A and bitvectors of B Select bitvectors of variable A Perform Index-based sampling on Variable A Select bitvectors of variable B
System Architecture Parse the metadata file Continue Iteractive Query Parse the SQL expression Generate query request Give up current corrlation result or not? Decide query types Read Joint Bitvectors Read bitvectors and generate joint bins Perform index-based data query and samling Calculate Correlation Metrics based on joint bitvectors Read the data value after finding satisfying result
User Interface Please enter variable names which you want to perform correlation queries: TEMP SALT UVEL Please enter your query: SELECT TEMP FROM POP WHERE TEMP>0 AND TEMP<1 AND depth_t<50; Entropy: TEMP: 2.29, SALT: 2.66, UVEL: 3.05; Mutual Information: TEMPSALT: 0.15, TEMP->UVEL: 0.036; Please enter your query: SELECT SALT FROM POP WHERE SALT<0.0346; Entropy: TEMP: 2.28, SALT: 2.53, UVEL: 3.06; Mutual Information: TEMPUVEL 0.039, SALT->UVEL->0.33; Please enter your query: UNDO Entropy: TEMP: 2.29, SALT: 2.66, UVEL: 3.05; Mutual Information: TEMPSALT: 0.15, TEMP->UVEL: 0.036; Please enter your query: SELECT SALT FROM POP WHERE SALT<0.0346; Entropy: TEMP: 2.22, SALT: 1.58, UVEL: 2.64; Mutual Information: TEMPUVEL 0.31, SALT->UVEL->0.21; ……
User Case Results • Histogram of SALT based on TEMP • Cold Water(TEMP<5): High SALT • Hot Water(TEMP>=15): High SALT • Entropy • TEMP: similar entropy • SALT: Diversity of SALT becomes bigger as TEMP increases • Mutual Information • Correlation between TEMP and SALT is high when TEMP is cold or hot
Experiment Results • Goals: • Speedup of correlation analysis using bitmap indexing • Scalability of parallel correlation analysis • Efficiency improvement in distributed environment • Efficiency and accuracy comparison with sampling • Datasets: • Parallel Ocean Program – Multi-dimensional Arrays • 26 Variables: TEMP (depth, lat, lon), SALT, UVEL …… • Environment: • OSC Glenn Cluster: each node has 8 cores, 2.6 GHz AMD Opteron, 64 GB memory, 1.9 TB disk
Correlation Efficiency Comparisonbased on Different Subsets • No Indexing (original): • Data Loading + Filtering • Joint Bins Generation (scan each data element) • Correlation Calculation • Dynamic Indexing: • Index Subset Loading • Joint BinsGeneration (bitwise operations) • Correlation Calculation • 1.78x to 3.61x speedup • Speedup becomes bigger as data subset size decreases • Static Indexing: • Joint Index Subset Loading • Correlation Calculation • 11.4x to 15.35x speedup • Variables: TEMP SALT, 5.6 GB each • Metrics: Entropy, Histogram, Mutual Info • Input: 1000 queries divided into 5 categories based on subsetting percentage
Parallel Correlation Analysisbased on Different Nodes# • Dim-based Partition: • The speedup is limited • 1.73x to 5.96x speedup • Every node can only generate joint bins • Joint bins from different nodes need to be transferred for a global reduction (big cost) • More nodes used means bigger network transfer and calculation cost • Value-based Partition: • Much better speedup • 1.87x to 11.79x speedup • Every node can directly calculate partial correlation metrics • Very small reduction cost • Variables: TEMP SALT, 28 GB each • Metrics: Entropy, Histogram, Mutual Info • Nodes#: 1 – 32, one core per node • Calculate correlations based on entire data • Speedup as more number of nodes used
Efficiency Improvement in Distributed Environment Local Data Server (1Gb/s) Remote Data Server (200Mb/s) • Data Size: 7Gb – 28 GB • Indexing Method: • Smaller data transfer time (index size is only 12.1% to 26.8% of the dataset) • Faster correlation analysis time (smaller data loading, faster joint bin calculation) • Speedup of using local data server (1 Gb/s): 1.87x – 1.91x • Speedup of using remote data server (200 Mb/s): 2.78x – 2.96x
Efficiency and Accuracy Comparison with Sampling • Select 10 Variables (1.4 GB each) and calculate mutual information between each pair (45 pairs) • Calculate correlation based on samples: • Joint bins generation time is great reduced • Extra cost: sampling time • Speedup: 1.34x – 6.84x • Use CFP to present relative mutual information differences (45 pairs) • More accuracy lost as smaller sample used, average accuracy lost : • 50% - 1.53%, 25% - 3.42% • 10% - 7.91%, 5% - 12.57% • 1% - 18.32%
Conclusion ‘Big Data’ issue brings challenges for scientific data management Correlation analysis is useful but time-consuming Improve the efficiency of correlation analysis using bitmap indexing Develop a tool to support interactive correlation analysis over flexible subsets of the data Support correlation analysis in parallel and distributed environments Combine data sampling with correlation analysis
Correlation Efficiency Comparisonbased on Different Data Sizes • No Indexing (original): • Data Loading • Joint Bins Generation • Correlation Calculation • Dynamic Indexing: • Index Loading • Joint BinsGeneration • Correlation Calculation • Still achieve a good speedup because of the faster data loading speed and joint bins calculation speed • Static Indexing: • Joint Index Loading • Correlation Calculation • Variables: TEMP SALT • Metrics: Entropy, Histogram, Mutual Info • Input: Data with different sizes
Parallel Correlation Analysisbased on Different Subsets • Dim-based Partition: • The speedup is limited • Bigger subsets will generate bigger number of joint bins • More data transfer and reduction cost as subset percentage increases • Value-based Partition: • Much better scalability • 1.17x to 1.58x speedup compared to dim-based partition • The speedup is not affected by data subset percentage • Variables: TEMP SALT, 28 GB each • Metrics: Entropy, Histogram, Mutual Info • Nodes#: 16 • Input: 1000 queries divided into 5 categories based on subset sizes