Download
1 / 12
120 likes | 241 Views
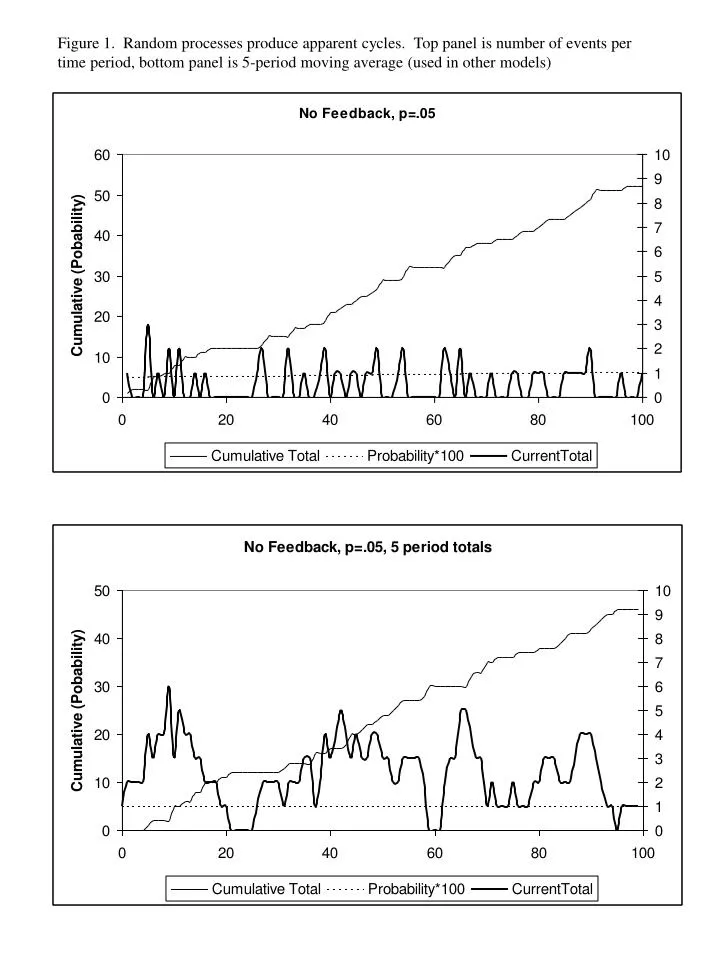
Figure 1. Random processes produce apparent cycles. Top panel is number of events per time period, bottom panel is 5-period moving average (used in other models).

E N D
Figure 1. Random processes produce apparent cycles. Top panel is number of events per time period, bottom panel is 5-period moving average (used in other models)
Figure 2. Diffusion from full networks. Top panel shows homogenous group in which everyone has initial probability of 5%. Bottom panel compares this group with heterogeneous group in which one actor has 40% initial probability and others 1%. Feedback weight is .005
Figure 4. Media coverage as flat percentage provides communication.
Figure 5. Media coverage affected by the size of action, i.e. the number of actors, compared to flat coverage rates.
Figure 7. Independent Issue attention cycle can wholly distort apparent protest cycle
Figure 8. Influence processes in cliqued, bridged and random networks. Network ties fixed. (In the random network, one actor happens to have no ties to others.)
Figure 9. Network ties are probabilistic and can be increased by contact. Each clique initially has 50% probability within clique and 5% between cliques. Average number of contacts gradually rises.
Figure 10. Hidden Organizing, Plus random noise. Random Networks
Figure 11. The average probability which is rising in hiding varies tremendously with network structure. Because of the skew in starting values, it is connection to Actor 1 that is especially important.
Figure 12. Probability of organizing for big event. Network structure can be seen in the average probability within cliques. Here the spread of organizing through the bridges can be seen. Full cliques have zero probability outside the organizer’s clique. Random networks show wide variability in the degree of cliquing.