Download
1 / 22
220 likes | 362 Views
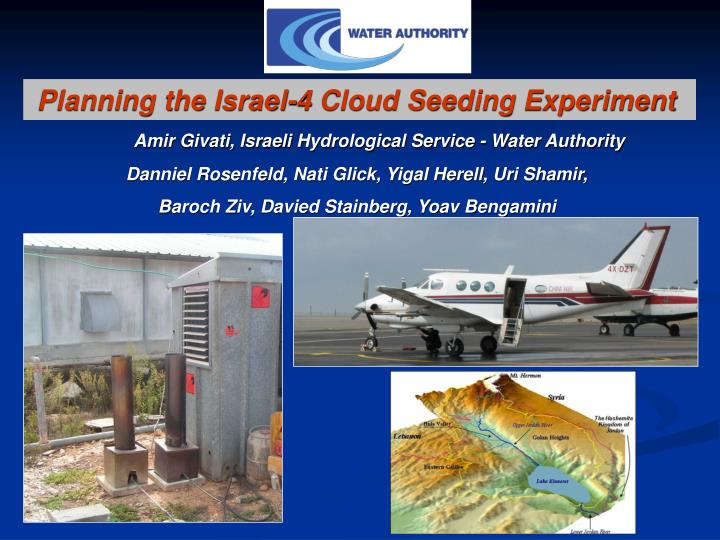
Planning the Israel-4 Cloud Seeding Experiment. Amir Givati, Israeli Hydrological Service - Water Authority Danniel Rosenfeld, Nati Glick, Yigal Herell, Uri Shamir , Baroch Ziv, Davied Stainberg, Yoav Bengamini. The experiment will focus on orographic clouds.

E N D
Planning the Israel-4 Cloud Seeding Experiment Amir Givati, Israeli Hydrological Service - Water Authority Danniel Rosenfeld, Nati Glick, Yigal Herell, Uri Shamir, Baroch Ziv, Davied Stainberg, Yoav Bengamini
The experiment will focus on orographic clouds. • New target area in the Sea of Galilee basin. • The statistical experiment will be done along with • microphysics measurements and chemical analysis. • New statistical analysis will be use in order to • evaluate the seeding effect in the target area: • Using simulations from high resolution numerical • models. The Israeli water Authority is about to conduct new cloud seeding experiment in the coming rainy seasons
Themethodology of the Israel-4 experiment : Shifting emphasis from seeding convective to orographic clouds at the catchment of Sea of Galilee: Golan and Hermon • New target area (The Golan heights and the Hermon). • Adding new seeding line inland. • Ground generators on the Galilee range mountain tops with double burners. • Cloud physics experiments (aircraft measurements) and numerical simulation of the seeding. • Chemical measurements (including Ag) in rain water at the target and control areas. • Hydrometric measurements at small basins in the target area to evaluate the seeding effects on water resources. • Using the high resolution WRF model forecast (1.3 km) in order to improve the seeding targeting. • Using the high resolution WRF model calculated precipitation as control for the formal statistical analysis of the experiment. Water Authority
Seeding Effects in Israel Water Authority
Israeli-1 Experiment : 1961-1967 Seeding line 30 minutes upwind the coastline Cross-Over random seeding allocation for the North or South target Seeding effect E=1.15 E=(TNs/TNu * TSs/TSu)0.5 Where: TNs: Rainfall in Target North when seeded TNu: Rainfall in Target North when un-seeded TSs: Rainfall in Target South when seeded TSu: Rainfall in Target South when un-seeded Significance=2% NORTH SOUTH Water Authority Gagin and Neumann, 1976
Eexp. Israel-2: 1969-1975 Seeding effect in the North: E=1.13 E=(TNs/TNu) * (CNs/CNu) Where: TNs: Rainfall in Target North when seeded TNu: Rainfall in Target North when un-seeded CNs: Rainfall in Control North when Target North seeded CNs: Rainfall in Control North when Target North un-seeded Significance=2% Seeding line in the south was extended along the coastline, leaving no control for evaluation the effect in the south alone. NORTH Target Control No Control Gagin and Neumann, 1981 SOUTH Target Water Authority
Ben zvi et al. 2010 Levin et al . 2010 Water Authority
The Kinneret basin Water Authority
Decreasing trend between precipitation in target vs. the control areas target control Water Authority Givati and Rosenfeld (2005) J. App. Met., 44, 1298-1398
The Sea of Galilee at thecity Tiberius The seeding areas in Israel-4: Upper Jordan River basin and the Lake of Galilee E. Seeding line Ground generators W. Seeding line Hydrometric stations Water Authority
A typical winter rainy day in Northern Israel Mostly orographic with less convection, less seeder-feeder, much less sea spray Occasionally Naturally seeded by mature anvils, Less sea spray Naturally seeded by sea spray Galilee Golan
Sharp contrast between sea&coastal and orographic cloud microstructure Rain Initiation Rain Initiation Rain Initiation Height [m] Cloud drop effective Radius [mm]
Sea & coastal Orographic Rain Initiation Rain Initiation LWC [g m-3mm-1] Cloud drop diameter [mm] Cloud drop diameter [mm]
Summary – cloud measurements • Convective clouds over sea are seeded hygroscopically naturally by sea spray during the winter storms. • During weak winds the convective clouds do contain much supercooled water, but in these infrequent situations they move slowly and do not penetrate much inland. • The strong winds during the winter storms create orographic clouds that are not as affected by sea spray, mainly over the eastern upper Galilee, Golan and Hermon. • The cloud drop effective radius and phase can be detected in real time with the MSG geostationary satellite. • We still need additional measurements for characterizing the amount of supercooled water in the various synoptic situations.
Chemical analysis in rain water at the target area • AgI is transported to the catchments area of the sea of Galilee as suggested by the Wilcoxon test and by a principal component analysis (not shown here). • AgI is taking an active role in the mixed phase precipitation process. • The use of satellite microphysics analysis in combination with careful chemical measurements is a powerful technique which can improve the efficiency of cloud seeding activities. Time series from Neve Ativ during the storm of 23-24 March 2009. The green line is three times EFAg. The light green (D.L. Ag (X3)), represents times where the Ag concentration was below Detection Limit (≈3ppt), where 3 ppt was applied. CH09-CH07 represent the satellite-retrieved cloud top phase. The blue line is the cloud top temperature and the pink line marks the aircraft seeding time corrected for wind drift. High EFAg values were measured when the rain fell from mix phase clouds. Lower EFAg value were measured when the rain fell from mostly warm clouds. Y. Erel, A.Zipori and D. Rosenfeld Water Authority
D1 D2 D3 Using calculated precipitation from the WRF high resolution model WRF Climo - FDDA Domains D4 WRF simulation of the material dispersion D1 98x84x37, DX = 40.5 km D2 106x115x37, DX = 13.5 km D3 91x91x37, DX = 4.5 km D4 112x154x37, DX = 1.5 km Rostkier-Edelstein, D., Y. Liu, G. Roux, A. Givati, A. Pietrkowski, M. Ge, A. Hahmann, J. Pinto, T. Warner and S. Swerdlin, 2009: High Resolution WRF-RTFDDA seasonal precipitation over complex terrain,Proceedings of the 10th Annual WRF User's Workshop, 23-26 June 2009, Boulder, CO. Water Authority
: Annual precipitation at 2009 -10 at the Hermon base rain gauge vs. calculated precipitation from the WRF model at 1.3 km resolution, WRF 4 km and according the regression model used by Rimmer and Selinger (2006) Givati et al. 2011, Using the high resolution WRF model for calculating stream flow in the Jordan River, J. Applied Meteorology and Climate, In Review. Water Authority
Observed accumulated precipitation at 2009-10 for the cluster of 4 rain gauges in the upper part pf the Kinnert basin vs. the WRF forecasted precipitation run at 1.3 km, 4 km and 12 km grid spacing. Givati et al. 2011, Using the high resolution WRF model for calculating stream flow in the Jordan River, J. Applied Meteorology and Climate, In Review. Water Authority
comparisons between actual to calculated precipitation in the target and control areas: The 2009 – 2010 rainy season N3 ActualDaily precipitation in the target (N3) vs. the control (C2) Calculated daily precipitation in the target (N3) vs. actual [mm] [mm] Water Authority Steinberg, Binjamini and Givati, 2010, Special report for the Water Authority
N8 Daily precipitation in the target (N8) vs. the control (C2) Calculateddaily precipitation in the target (N8) vs. actual [mm] [mm] Water Authority Stainberg, Binjamini and Givati, 2010, special report for the Water Authority
Summary • Aircraft measurements show seeding potential in the orographic clouds in north - east Israel. • Chemical analysis reveal that the seeding material reachs the target area and takes part in the precipitation formation process in the clouds. • Cloud seeding in Israel-4 will focus on orographic clouds located in the upper Galilee, Golan heights and the Hermon ranges, and not on convective clouds that come from the Mediterranean Sea. • New methodologies will be used to conduct the seeding activities and also to evaluate their effects: WRF for dispersion simulations, evaluating with double ratio based on high resolution meteorological models, microphysical analysis of cloud properties from satellite and chemical analyses of rain water. Water Authority