Download
1 / 44
440 likes | 565 Views
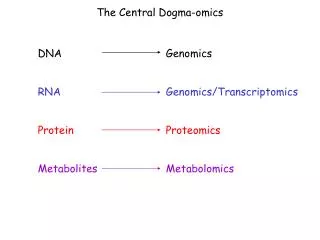
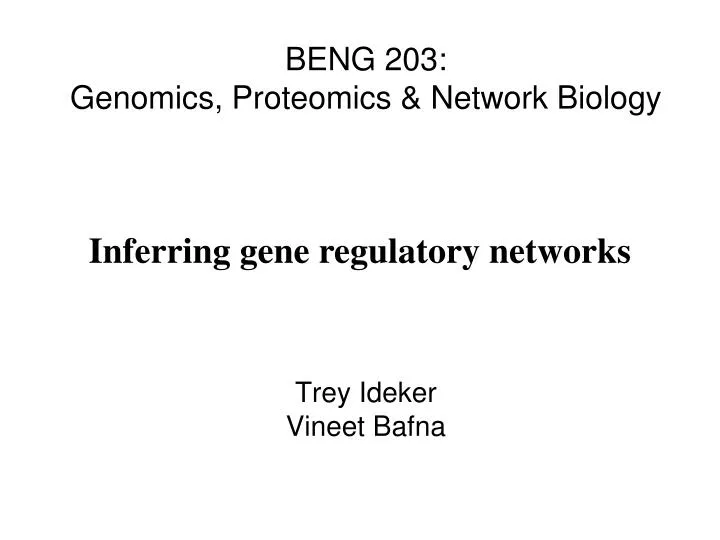
BENG 203: Genomics, Proteomics & Network Biology. Inferring gene regulatory networks. Trey Ideker Vineet Bafna. Reading assignment.

E N D
BENG 203:Genomics, Proteomics & Network Biology Inferring gene regulatory networks Trey Ideker Vineet Bafna
Reading assignment Gardner, di Bernardo, Lorenz, and Collins. Inferring Genetic Networks and Identifying Compound Mode of Action via Expression Profiling. Science301, pp.102-105 (2003) Cell. 2011 Jan 21;144(2):296-309. Densely interconnected transcriptional circuits control cell states in human hematopoiesis. Novershtern N, Subramanian A, Lawton LN, Mak RH, Haining WN, McConkey ME, Habib N, Yosef N, Chang CY, Shay T, Frampton GM, Drake AC, Leskov I, Nilsson B, Preffer F, Dombkowski D, Evans JW, Liefeld T, Smutko JS, Chen J, Friedman N, Young RA, Golub TR, Regev A, Ebert BL.
Early efforts for network inference: OUTLINE • Boolean Networks • Gene expression state space • Discrete Dynamical Systems • Reverse Engineering of Networks • Entropy • Mutual Information • REVEAL algorithm • Other methods: • Linear and non-linear regression • Bayesian inference methods
0 1 1 1 Where should state 4 appear?
What are some biological interpretations of basins and attractors?
Entropy “H” • Measures amount of information in a signalHigh information content = high disorder 11111111 00000000 01011100 Low Low High • H(x) = – p1log2p1 – p2log2p2 – … – pmlog2pmArguments p1, p2, …, pm are the probabilities (frequencies) for the m possible values of a signal x (probs. must sum to 1) • Maximum entropy is obtained when all values are equally likely; it approaches 0 when one value dominates What is the maximum entropy for a binary signal?
Entropy for m = 2 1 H 0 0 1 p(x)
Mutual Information Indicates ability to predict value of one variable given the value of the other. A low value = low predictive ability (independence)A high value = high predictive ability
H(X|Y) H(Y|X) H(X) H(Y) H(X,Y) M(X,Y) Venn diagram representation
A B C A′ = B B′ = A or C C′ = (A and B) or (B and C) or (A and C) A′ B′ C′
REVEAL Algorithm • To determine the gene input(s) for gene output Y′, identify any gene X for which: H(X,Y′) = H(X) • Considering the entropy of the joint output/input is no greater than the input alone—i.e., output is completely determined from input. • An alternate view in terms of mutual information: M(X,Y′) / H(Y′) = 1
Example: A′ is completely predicted by B What about other gene outputs?
Results with REVEAL • Liang, Furman and Somogyi (1998). REVEAL: A general reverse engineering algorithm for inference of genetic network architectures, Pac Symp Biocomp. • Shown to correctly infer small (simulated) networks if given sufficient number of examples • Data requirements growth exponentially, but can still provide likely results with limited data • Correlation Metric Construction is a related method that is based on correlation instead of entropy (Adam Arkin and John Ross)
Modeling expression with differential equations Assumes network behavior can be modeled as a system of linear differential equations of the form: dx/dt = Ax + u x is a vector representing the continuous-valued levels (concentrations) of each network component A is the network model: an N x N matrix of coefficients describing how each xi is controlled by upstream genes xj, xk, etc. uis a vector representing an external additive perturbation to the system
An example:From discrete- to continuous-valued networks x1 x2 x3 Three genes: x1, x2, x3 x1 activates x2 x2 activates x1 and x3 x3 inhibits x1 x1 x2 x3 dx/dt = Ax + u dx1/dt = a12x2 -a13x3 dx2/dt = a21x1 dx3/dt = a32x2
The steady state assumption • Near a steady-state point, expression levels do not change over time. • Under the steady-state assumption, the model reduces to 0 = Ax + u Ax = -u • A straightforward method to infer A would be to apply N perturbations, u, to the network, in each case measuring steady-state expression levels for the x. • However, in larger networks it may be impractical to apply so many perturbations • As a simplifying assumption, consider that each gene has a maximum of k non-zero regulatory inputs.
The inference procedure Ax = -u • Infer inputs to each gene separately • For the given gene, consider all possible combinations of the k regulatory inputs • For each combination, use multiple linear regression to determine optimal values of the k coefficients • Choose the combination that fits the observed data with the least error
Multiple regression u = -Ax A is the fit u u x1 x x2
Review of paper by Gardner et al: Gardner, di Bernardo, Lorenz, and Collins. Inferring Genetic Networks and Identifying Compound Mode of Action via Expression Profiling. Science301, pp.102-105 (2003)
Overview • Systems study of the Escherichia coli DNA damage (SOS) response, a well-studied pathway. • Systematic transcriptional perturbations (overexpressions) to nine SOS genes, characterized by the steady-state gene expression response of each. • Use of multiple linear regression to determine a network of causal relations (connections) among these genes. • A recent example from a larger body of work using systems linear equations to infer regulatory networks.
Application to E. coli SOS pathway • The SOS pathway regulates cell survival and repair after exposure to DNA damage • The known pathway involves three tiers of transcription factors (TFs): • lexA and recA • ssb, recF, dinI, umuDC • rpoD, rpoH, rpoS (so-called ‘sigma’ factors) And more than 30 downstream regulated genes… • The known network involving these nine core genes was chosen as a proof-of-principle of the linear regression inference approach
Experimental perturbations pBADX53 plasmidIn each perturbation, a different gene (of the nine) was overexpressed with an arabinose-controlled expression plasmidRBS = Ribosome Binding Site
Experimental measurements • For each perturbation and for each of nine transcripts, steady-state expression levels were measured with quantitative real-time polymerase chain reaction (qPCR). • The ratio of these perturbed levels to the unperturbed levels was computed. • Mean and std error was computed over 16 replicate measurements.
Model inference These data were used as a training set to solve for the coefficients in the matrix A, i.e. the regulatory interaction model. The assumed number of inputs k = 5
Actual method performance • The inferred network was compared to the known ‘test’ network. • Performance was evaluated as the number of connections in the test network that were resolved in the inferred network. • Here, resolved means that there was a path between the two genes in the inferred network and that the overall sign (+ or -, activation or inhibition) was also correct. Wait a minute, what are the implications of this? Coverage = identified connections/total true connections False Positive Rate = incorrectly identified connections/ total identified connections
Simulated algorithm performancefor 9 perturbations 7 perturbation subset Actual experimental datanoise = Sx/mx
Simulated algorithm performancefor 9 perturbations Actual experimental data 7 perturbation subset
Using the model predictively • To what extent can the model predict expression changes that fall outside of the training set used to build it? • Along these lines, Gardner et al. use the model to distinguish expression levels of genes that are directly targeted by a drug (the mode of action or MOA) vs. secondary effects. • The direct targets represent the minimal set of genes that produce the observed expression pattern when externally perturbed.
Procedure of identifying drug MOA • Measure expression changes xpresulting from treatment with drug • The drug effect is an unknown external perturbation up that produces the changes: up = -Axp As proof-of-concept, the following experiments were performed: • lexA/recA double perturbation • Mitomycin C (MMC) perturbation, known to activate recA through DNA damage
Identifying compound mode of action Perturbation: recA/lexA MMC The model is much more predictive than are expression data alone…