Download
1 / 28
290 likes | 413 Views
Estimation of Gross Domestic Product (GDP ) (with Indian experience). Contributed by the National Academy of Statistical Administration Central Statistics Office, India . Estimation of Gross Domestic Product (GDP). Three approaches Production approach Income approach Expenditure approach

E N D
Estimation of Gross Domestic Product (GDP)(with Indian experience) Contributed by the National Academy of Statistical Administration Central Statistics Office, India
Estimation of Gross Domestic Product (GDP) • Three approaches • Production approach • Income approach • Expenditure approach • In theory the three approaches give same result of GDP of the economy • In practice the estimates have to be reconciled in the Supply and Use Tables
Estimation of GDP- Production approach • In production approach the GDP is obtained as the sum of gross value added (GVA) of all resident producer units (institutional units/sectors, or industries) at basic prices plus taxes less subsidies on products • GVA at basic prices of a producer unit/ industry is estimated as the difference between its output at basic price and intermediate consumption at purchaser’s price GVA at basic prices = Output at basic price - Intermediate consumption at purchaser’s price
Estimation of GDP- Production approach (Contd.)-- Output • Output may be: market output, produced for own final use, or non-market output • Total value of output produced for own final use includes • Total value of output produced by household enterprise and consumed by same household • Total value of fixed assets produced by a unit that are retained by it for use in future production • Total value of change in inventories of finished goods and work-in-progress
Estimation of GDP- Production approach--Output (Contd.) • Non-market output is valued at cost basis. • Thus the value of non-market output equals Value of intermediate consumption at purchaser’s price + Compensation of Employees (CE) + Consumption of Fixed Capital (no operating surplus) • Output of a trading enterprise/unit is the margin it gets, computed as Sales value – Purchase value + Additions to stocks of the products it trades
Estimation of GDP- Production approach--Output (Contd.) • Output of financial intermediaries is the sum of actual sales (charges) it receives for its services and financial intermediation services indirectly measured (FISIM) • FISIM is computed as total interest received minus total interest paid • To avoid double counting FISIM is allocated to the industries as intermediate consumption (thus subtracted from the GVA of various industries) and final uses in proportion to the services used by them
Estimation of GDP- Income approach • In income approach estimation the income that generates to the owners of resources while the industry produces goods and services are to be captured • Thus for each of the industry the following components of GVA are to be obtained (i) Compensation of employees (payments made to the owner of human resource for labour ) (ii) Net Operating Surplus (iii) Consumption of fixed capital (CFC)
Estimation of GDP- Income approach (Contd.) • Gross Operating Surplus is Net Operating Surplus + CFC • Gross Operating Surplus includes payments made to the owners of all other resources: rent to the owner of natural resource, interest to the owner of financial resource, profit/loss to the entrepreneurship, capital services to the owner of produced resource, in short all primary incomes other than compensation for labour) • Taxes less subsidies on production (which are irrespective of sales or profitability) are inside the GVA and thus inside the operating surplus
Estimation of GDP- Expenditure approach GDP at market price is estimated as the sum total of all final uses listed below: • Household Final Consumption Expenditure • Non-profit Institutions serving households (NPISH) Final Consumption Expenditure • Government Final Consumption Expenditure • Gross Fixed Capital Formation • Change in Stocks • Acquisition less disposals of Valuables • Net Exports (Exports less Imports both valued at f.o.b.)
Classification of Final Consumption Expenditure There are three international classification schemes of expenditure according to purposes that help to aggregate final consumption expenditure and actual final consumption for comparison purposes: a) The Classification of Individual Consumption According to Purpose (COICOP) b) The Classification of the Purposes of Non-Profit Institutions Serving Households (COPNI) c) The Classification of the Functions of Government (COFOG)
Main classes of consumption by purposes (COICOP) a) Food and non-alcoholic beverages b) Alcoholic beverages, tobacco and narcotics c) Clothing and footwear d) Housing, water, electricity, gas and other fuels e) Furnishings, household equipment and routine maintenance f) Health g) Transport h) Communication i) Recreation and culture j) Education k) Restaurant and hotels l) Miscellaneous goods and services
Main classes of consumption by purposes (Contd.) • Individual consumption of NPISH (COPNI) • i) Housing • ii) Health • iii) Recreation and culture • iv) Education • v) Social protection • vi) Other services • Individual consumption expenditure of general government (COFOG) • i) Housing • ii) Health • iii) Recreation and culture • iv) Education • v) Social protection
Estimation of GDP- in Indian National Accounts • In Indian national accounts a mixed (production and income) approach is followed in different sectors .The economy is divided broadly by economic activity following National Industrial Classification (NIC) that is fully compatible with the International Standard on Industrial Classification (ISIC) • GVA is estimated by economic activity by following broad classes as well as at disaggregated level: 1. Agriculture, Forestry and Fishing 2. Mining and Quarrying 3. Manufacturing- Registered and Unregistered
Estimation of GDP (Contd.) 4. Electricity, Gas and Water supply 5. Construction 6. Trade, Hotels and restaurants 7. Transport: Railways, Transport by other means, Storage and Communication 8. Financing: Banking , Insurance, Real Estate, Ownership of dwellings and Business services 9. Community, social and personal services: Public Administration and Defence, and Other services
Estimation of Gross State Domestic Product (GSDP) • Estimates of income at State level are prepared following income originating rather than income accruing approach due to practical reasons • Estimation of GVA of supra-regional sectors which cut across the boundary of states (Railways, Communication, Banking and Insurance and Central Government Administration) are done centrally by CSO by allocating the country level estimate to the states on the basis of appropriate indicators • Methodology of estimation of GVA of all sectors (except supra-regional) is similar to the one at country level
Estimation of GSDP (Contd.) • Estimation of GVA of supra-regional sectors : • Railways: All India GVA figure segregated into CE and operating surplus are extracted from budget documents. General Manager’s annual report of nine zones and Indian Railways Annual Statistical Statements (IRASS) help in segregating GVA to nine zones • CE of Railway Board and its offices is allocated to the states where the offices are located
Estimation of GSDP (Contd.) • GVA on account of passenger and goods traffic for each zone is distributed to different states on the basis of average total daily number of vehicles run on the section and net tonne km per route km per day respectively among different states falling within a zone • Banking and Insurance: For banks all India estimate of CE are distributed among states on the basis of number of employees located in the state. For other categories of institutions appropriate indicators (W&S, loan outstanding, financial disbursement , loan released) are used to allocate GVA to states
Estimation of GSDP (Contd.) • For Post Office SB all India estimate of GVA is allocated in the ratio of state wise gross collections under small saving schemes • For Life Insurance Corporation all India CE is distributed in the ratio of state wise no. of employees and surplus and commission to agents in proportion of state wise net premium income • For Non-life Insurance all India estimate of GVA is allocated in the ratio of state wise income from business • For post s and communication data for indicators is received from the Department s of Post and Communication
Estimation of GSDP (Contd.) • For Central Government Administration CE of defence employees, offices abroad, para military forces, Issue Dept of RBI, atomic energy are netted and the balance is distributed in the ratio of state wise number of central government employees • Off shore activities of drilling oil are excluded. GVA of Air and water transport are distributed on the basis of suitable indicators by CSO • NSDP divided by the estimated mid year population of the state is the per capita state income
National Accounts Statistics – in Indian Statistical System • Indian Statistical System is decentralized. • Decentralization in two ways- by subject and by area. • As per Constitution there are three list: Central, State and Concurrent fixing responsibility of collecting statistics of subjects as per list by the Center and State governments. However much of statistics is in concurrent list and both Center and States are involved in collecting statistics • National / State Domestic Product and national accounts statistics are organized as coordinated activity .
National Accounts Statistics – in Indian Statistical System • At center the Central Statistics Office (CSO) and at State/UT the Directorate of Economic s and Statistics (DESs) have the responsibility of compiling National Accounts/GSDP estimates • CSO publishes annual estimates of national income and related macro-economic aggregates in the National Accounts Statistics. • The statistics include important aggregates and Accounts,and: • Important aggregates of national income and related aggregates • Accounts of the nation • Gross/Net Domestic Product by economic activities at current and constant prices
National Accounts Statistics – in Indian Statistical System (Contd.) • The statistics include: • Public Sector Transactions • Final Consumption Expenditure, Saving and Capital Formation • Disaggregated Statements • Special Statements which include Net Fixed Capital Stock, • Quarterly estimates of GDP at current and constant prices, Advanced estimates of GDP, Rural / Urban estimates (decennially), Estimates of Livestock • State/ UT DESs publish Gross/Net State Domestic Product by economic activity at current and constant prices
National Accounts Statistics – in Indian Statistical System (Contd.) • Many States also prepare estimates of Fixed Capital Formation and Final Consumption Expenditure • CSO prepares periodically (every five years) Input Output Transactions Tables (IOTT) of the economy. Some States have also prepared State IOTT • CSO also prepares Comparable Estimates of State Domestic Product which are prepared for the Finance Commission for use in devolution of funds
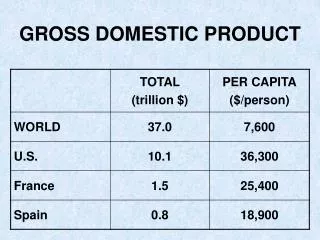
National Accounts Statistics – Uses • National Accounts Statistics are the only indicators demonstrating health of the economy. • GDP/ GSDP estimates by economic activities show the contribution and importance of the various sectors of the economy • GDP/ GSDP estimates at constant prices are indicators of real income and growth shows the path of the economy. • Estimates of per capita income are indicators of average well being of people.
National Accounts Statistics – Uses (Contd.) • Estimates of Household/ Private Final Consumption Expenditure are used in determining poverty estimates • Estimates of Government Final Consumption Expenditure are used for determining individual and collective expenditure of government for the people • Estimates of Saving rate and Capital Formation rate are indicators for the growth path of the economy • All aggregates of National accounts are required by Policy makers, Planning experts, Researchers and Analysts
National Accounts Statistics – Uses (Contd.) • Estimates of Sectoral Output, Input and Gross Value Added are used for Productivity analysis • IOTT has beside consistency checks many uses for planning and other researches. It can show backward and forward linkages, impact of taxes on products, direct and indirect requirements of various production • Performance of Public sector can only be seen through Public sector accounts which are not visible in the budget documents. • Disaggregated statements provide wealth of information for analysts
National Accounts Statistics – Uses (Contd.) • GDP is used as denominator in several important economic indicators like saving rate, capital formation rate, tax rate, fiscal deficit, etc. • Capital Stock is good indicator of wealth whereas NNI is for income • Labour productivity, capital productivity, total productivity and various macro-economic models require information on long series of national accounts • Quarterly estimates are the requirements of Policy makers for quick review
References • National Accounts Statistics, 2011, CSO, MOSPI • National Accounts Statistics: Sources and Methods, 2007, CSO, MOSPI • Final Report of the Committee on Regional Accounts, CSO, Department of Statistics, Ministry of Planning, GOI, September, 1976