Download
1 / 35
370 likes | 778 Views
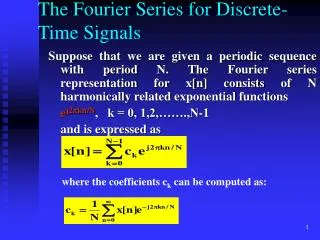
Chapter 3. The Discrete-Time Fourier Analysis. Gao Xinbo School of E.E., Xidian Univ. Xbgao@ieee.org http://see.xidian.edu.cn/teach/matlabdsp/. Introduction. A linear and time-invariant system can be represented using its response to the unit sample sequence.

E N D
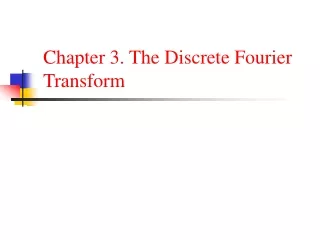
Chapter 3. The Discrete-Time Fourier Analysis Gao Xinbo School of E.E., Xidian Univ. Xbgao@ieee.org http://see.xidian.edu.cn/teach/matlabdsp/
Introduction • A linear and time-invariant system can be represented using its response to the unit sample sequence. • h(n) is called as the unit impulse response • y(n)=x(n)*h(n): system response • The convolution representation is based on the fact that any signal can be represented by a linear combination of scaled and delayed unit samples. • We can also represent any arbitrary discrete signal as a linear combination of basis signals introduced in Chapter 2.
Introduction (con’t) • Each basis signal set provides a new signal representation. • Each representation has some advantages and disadvantages depending upon the type of system under consideration. • When the system is linear and time-invariant, only one representation stands out as the most useful. It is based on the complex exponential signal set and is called the discrete-time Fourier Transform.
The discrete-time Fourier transform (DTFT) DTFT: IDTFT: Existence Condition: x(n) is absolutely summable.
DTFT • F[.] transforms a discrete signal x(n) into a complex-valued continuous function X of real variable w, called a digital frequency, which is measured in radians. • Time domain -- Frequency domain • Discrete -- Continuous • Real valued -- Complex-valued • Summation -- integral • The range of w: • The integral range of w:
Examples • 3.1 Determine the discrete-time Fourier transform of • Result visualization with Matlab • Complex function: magnitude and angle; • real/imaginary part with respect to w • The range of w: • showing interval: [0,pi]
Two important properties • Periodicity: • The DTFT is periodic in w with period 2pi • Implication: we need only one period for analysis and not the whole domain • Symmetry: • For real-valued x(n), X is conjugate symmetric. • Implication: to plot X, we now need to consider only a half of X: [0,pi]
Matlab Implementation • If x(n) is of infinite duration, then Matlab can not be used directly to compute X from x(n). • We can use it to evaluate the expression X over [0,pi] frequencies and then plot its magnitude and angle (or real and imaginary parts). • For a finite duration, the DTFT can be implemented as a matrix-vector multiplication operation. • w: continuous--discrete
Example • x(n)={1,2,3,4,5} n=-1:3; x=1:5; K=0:500; w=(pi/500)*k; X=x*(exp(-j*pi/500).^(n’*k); magX=abs(X); angX=angle(X); realX = real(X); imagX = imag(X); subplot(2,2,1); plot(k/500,magX); grid; xlabel(‘frequency in pi unit’); title(‘Magnitude Part’);
Examples • Example3.5 • Complex-valued signal • The DTFT is periodic in w but it is not conjugate-symmetric. • Example3.6 • Real-valued signal • Periodic in w and conjugate-symmetric • Therefore for real sequence we will plot their Fourier transform magnitude and angle responses from 0 to pi.
The properties of the DTFT • 1. Linearity: • The DTFT is a linear transformation. • 2. Time shifting: • A shift in the time domain corresponds to the phase shifting. • 3. Frequency shifting: • Multiplication by a complex exponential corresponds to a shift in the frequency domain. • 4. Conjugation: • Conjugation in the time domain corresponds to the folding and conjugation in the frequency domain.
The properties of the DTFT • 5. Folding: • Folding in the time domain corresponds to the folding in the frequency domain. • 6. Symmetries in real sequence: • Implication: If the sequence x(n) is real and even, then X is also real and even.
The properties of the DTFT • 7. Convolution: • 8. Multiplication • Periodic convolution (discussed in Chapter 5) • 9. Energy Parseval’s Theorem Energy density spectrum
The frequency domain representation of LTI system • The Fourier transform representation is the most useful signal representation for LTI systems. • It is due to the following result: • Response to a complex exponential ejw0n • Response to sinusoidal sequences • Response to arbitrary sequences
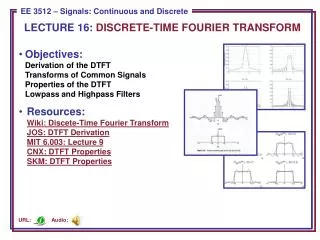
Response to a complex exponential • Frequency response: the DTFT of an impulse response is called the frequency response (or transfer function) of an LTI system and is denoted by H(). The output sequence is the input exponential sequence modified by the response of the system at frequency w0
In general, the frequency response H is a complex function of w. • The magnitude |H| is called the magnitude (gain) response function, and • the the angle is called the phase response function.
Response to sinusoidal sequences Steady-state response
Response to arbitrary sequences • Condition: • Absolutely summable sequence • LTI system
Frequency response function from difference equations • When an LTI system is represented by the difference equation, • then to evaluate its frequency response , we would need the impulse response h(n). • We know that when , then y(n) must be
Sampling and reconstruction of analog signals • Analogy signals can be converted into discrete signals using sampling and quantization operations: analogy-to-digital conversion, or ADC • Digital signals can be converted into analog signals using a reconstruction operation: digital-to-analogy conversion, or DAC • Using Fourier analysis, we can describe the sampling operation from the frequency-domain view-point, analyze its effects and then address the reconstruction operation. • We will also assume that the number of quantization levels is sufficiently large that the effect of quantization on discrete signals is negligible.
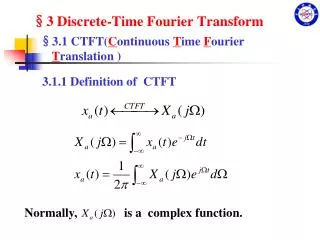
Sampling Continuous-time Fourier transform and inverse CTFT • Absolutely integrable • Omega is an analogy frequency in radians/sec
Sampling • Sample xa(t) at sampling interval Ts sec apart to obtain the discrete-time signal x(n) 1. X is a countable sum of amplitude-scaled, frequency-scaled, and translated version of Xa 2. The above relation is known as the aliasing formula
The analog and digital frequencies Fs: the sampling frequency, sam/sec • Amplitude scaled factor: 1/Ts; • Frequency-scaled factor: ω=ΩTs (ω=0~2π) • Frequency-translated factor: 2πk/Ts;
Meaning of Fig. 3.10 • Suppose signal band is limited to ±Ώ0, • If Ts is small, Ώ0Ts<π, or • F0= Ώ0/2 π < Fs/2=1/2Ts • Then the freq. Resp. of x(t) is an infinite replica series of its analog signal xa(t), • If Ts is large, Ώ0Ts>π, or • F0= Ώ0/2 π > Fs/2=1/2Ts • Then the freq. Resp. of x(t) is a overlaped replica of its analog signal xa(t), so cannot be reconstructed
Ban-limited signal • A signal is band-limited if there exists a finite radians frequency Ώ0 such that Xa(j Ώ) is zero for | Ώ |> Ώ0. • The frequency F0= Ώ0 /2pi is called the signal bandwidth in Hz • Referring to Fig.3.10, if pi> Ώ0Ts, then
Sampling Principle • A band-limited signal xa(t) with bandwidth F0 can be reconstructed from its sample values x(n)=xa(nTs) if the sampling frequency Fs=1/Ts is greater than twice the bandwidth F0 of xa(t) , Fs >2 F0. • Otherwise aliasing would result in x(n). The sampling rate of 2 F0 for an analog band-limited signal is called the Nyquist rate.
Impulse train conversion Ideal lowpass filter Reconstruction Interpolating formula 1. Lowpass filter band-limited to the [-Fs/2,Fs/2] band 2. The ideal interpolation is not practically feasible because the entire system is noncausal and hence not realizable.
Practical D/A converters • Zero-order-hold (ZOH) interpolation: • In this interpolation a given sample value is held for the sample interval until the next sample is received. • It can be obtained by filtering the impulse train through an interpolating filter of the form
ZOH Post-Filter Zero-order-hold (ZOH) interpolation • The resulting signal is a piecewise-constant (staircase) waveform which requires an appropriately designed analog post-filter for accurate waveform reconstruction.
First-order-hold (FOH) interpolation • In this case the adjacent samples are joined by straight lines.
Cubic-order-hold (COH) interpolation • This approach uses spline interpolation for a smoother, but not necessarily more accurate, estimate of the analog signal between samples. • Hence this interpolation does not require an analog post-filter • The smoother reconstruction is obtained by using a set of piecewise continuous third-order polynomials called cubic splines
Matlab Implementation N=n1:n2; t=t1:t2; Fs=1/Ts; nTs = n*Ts Xa = x*sinc(Fs*(ones(length(n),1)*t- nTs’*ones(1,length(t)))) ZOH: stairs FOH: plot Cubic spline interpolation: Xa=spline(nTs, x, t)
Reference and assignments • Textbook: pp40 to pp73 • Chinese reference book: pp28~34,37~43 pp19~25 • Exercises: • 1: Textbook: p3.1; p3.3b,e; p3.4 • 2: Textbook 3.16b;3.18; Optional: p3.7; 3.15 • 3: Optional: Textbook: p3.20a,b;