Download
1 / 14
140 likes | 200 Views
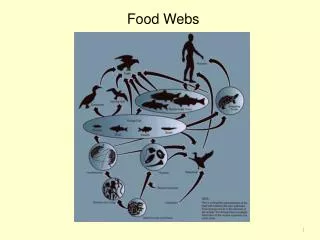
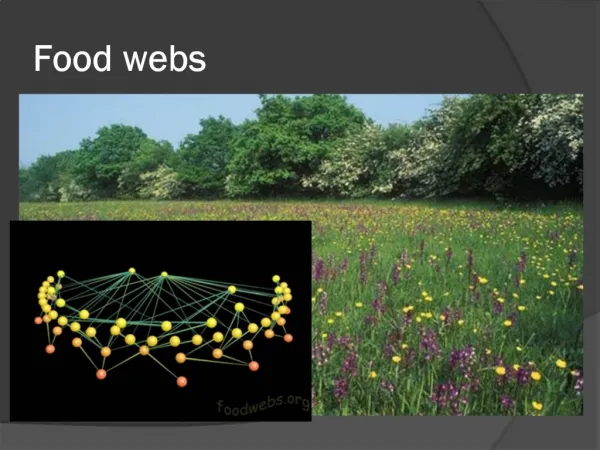
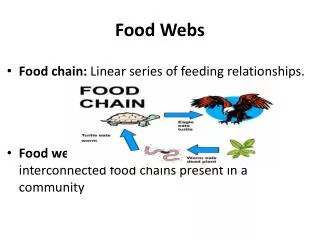
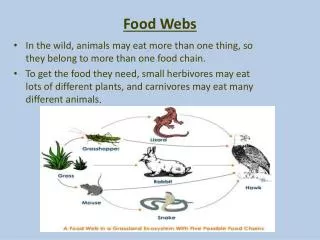
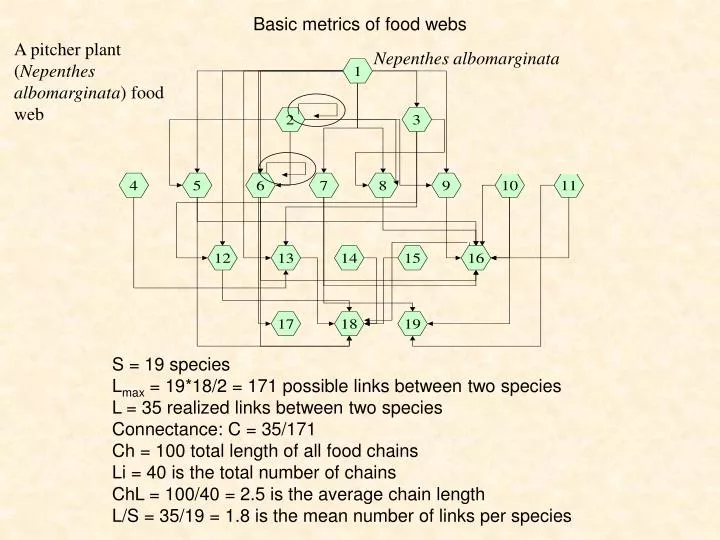
Basic metrics of food webs. A pitcher plant ( Nepenthes albomarginata ) food web . Nepenthes albomarginata. S = 19 species L max = 19*18/2 = 171 possible links between two species L = 35 realized links between two species Connectance : C = 35/171

E N D
Basic metrics of foodwebs • A pitcher plant (Nepenthes albomarginata) food web Nepenthes albomarginata S = 19 species Lmax = 19*18/2 = 171 possiblelinksbetweentwospecies L = 35 realizedlinksbetweentwospecies Connectance: C = 35/171 Ch = 100 totallength of allfoodchains Li = 40 isthetotalnumber of chains ChL = 100/40 = 2.5 istheaveragechainlength L/S = 35/19 = 1.8 isthemeannumber of links per species
Foodwebmetricstranslatedintomatrixmetrics N = 28 Fill = 28/80=0.35 Dm=28/10=2.8 Dn=28/8=3.5
Metrics of speciesassociationsinbiogeographicmatrices TheC-score as a metric of negativeassociations Checkerboards TheClumping-score as a metric of positiveassociations TheTogetherness-score as a metric of nicheoverlap
Theadditivenature of theC-score Numbers of checkerboards for entrieswithinthearea AT are a measure of spatialspeciesturnover. Numbers of checkerboards for entrieswithinthearea ATC are a measure of turnover independent speciessegregation. CMixed = CS – CTurn - CSegr. Therankcorrelation of matrixentriesis a metric of spatialturnover. • 11 21 32 12 2…….7 108 10 R2is a moreliberalmetricthanCturn. R2 = 0.347 Thecorrelation of ordinationscoresisalso a metric of turnover but even less selective.
Rangesizecoherence Coherentrangesize Scatteredrangesize Thereare 17 embeddedabsences. Thenumber of embeddedabsencesis a measure of speciesrangesizecoherence. Themetricdependsstrongly on theordering of rows and columns
Themeasurement of nestedness Thedistanceconcept of nestedness. Sort thematrixrows and olumnsaccording to some gradient. Define an isoclinethatdividesthematrixinto a perfectlyfilled and an empty part. Thenormalizedsquared sum of relativedistances of unexpectedabsences and unexpectedpresencesisnow a metric of nestednessis.
Nestedness based on Overlap and Decreasing Fill (NODF) NODF is a gap basedmetric and moreconservativethantemperature.
The disorder measure of Brualdi and Sanderson Ho many cellsmust be filledoremptied to achieve a perfectlyorderedmatrix. TheBrualdiSandersonmeasureis a count of thisnumber Discrepancyis a gap countingmetric.
How to measurespeciesaggregation? dij Nearestneighbormetrics Nearestneighbouris a presence – absencemetric Compartmentedmatrix NND hasweakpowerathighermatrixfill Joincountstatistics Othermetricsproposed: Morisita Simpson Soerensen Block variance Ordinationscorevariance Marginalvariances A sum of cellentriesaround a focalcellmultiplied by theentry of thefocalcell Joincountoperates on presence – absence and abundancematrices Thesemetricshaveverylowpower a moderate to smallmatrixsize and high orlowmatrixfill.
Abundancebasedmetrics TheC-scoreextension The metric CA is a count of the number of abundance checkerboards in the matrix. Other 2x2 submatricescatchmatrixpropertiesthathave not welldefinedecologicalmeaning.
Nestednessinabundancematrices Themetricis a sum of allpairsinthematrix (first sortedaccoding to speciesrichnessthensortedaccording to weights), wheretheweightintherow/column of lowerspeciesrichnessissmallerthantheweightintherow/column of higherspeciesrichness
Patterndetectioninlargematrices Pajek: software for socialnetworkanalysis WAND: ecologicalnetworkanalysis Theseprogramsuseclusteranalysis and ordination to sort thematrixaccording to numbers of occurrences. Didstancemetricsarethenused to identifycompartments. Theygeneratehypothesesaboutmatrixstructure. They do not fullyallow for statisticalinference. KliqueFinder: software for compartmentanalysis